The EVA Monster Series: Will Intuit’s Management Prove Us Wrong?

With this series, we’d like to give you some perspective on the companies in our distinguished EVA Monster universe. This rare breed of quality-growth stocks is worthy of your attention, and getting to know these businesses may pay off handsomely down the road.

As a quick recap, EVA Monsters have three things in common:

  • They earn high returns on the capital they employ.
  • They have growth opportunities that allow them to reinvest most of their cash flows at high rates of return.
  • They have a sustainable competitive advantage (that Warren Buffett calls “moat”), which prevents their competitors from taking away their extraordinary profitability.

These characteristics tend to result in a strong (double-digit) fundamental return potential, meaning that no valuation tailwind is necessary to get great investment results with EVA Monsters. (These case studies explain this pretty well.)

As Charlie Munger said:

“Over the long term, it’s hard for a stock to earn a much better return that the business which underlies it earns. If the business earns 6 percent on capital over 40 years and you hold it for that 40 years, you’re not going to make much different than a 6 percent return – even if you originally buy it at a huge discount. Conversely, if a business earns 18 percent on capital over 20 or 30 years, even if you pay an expensive looking price, you’ll end up with one hell of a result.”

We also shared the math proof of why buying EVA Monster stocks at a fairish valuation makes perfect sense for long-term investors. (Look for the “math example” in this post to alleviate your doubts.)

To round off the short introduction, we (1) try to avoid overpaying for EVA Monsters, (2) closely monitor the fundamental performance and management’s capital allocation decisions throughout our holding period, and (3) hold our positions as long as the underlying investment thesis remains intact, ideally for decades, to let compounding do the heavy lifting.

Without further ado, numbers show that Intuit (INTU) exhibits EVA Monster characteristics and is thus worthy of your attention.

Intuit is a diversified software company providing various services to small and medium-sized enterprises and individual customers. Its core offerings include the QuickBooks accounting suite and the TurboTax tax filing toolset. In addition to migrating its legacy desktop solutions to a cloud-based software-as-a-service (SaaS) model, the company has recently broadened its portfolio through major acquisitions. The Credit Karma personal finance platform and the Mailchimp email marketing solution are its most significant additions. The company was founded in 1983 and is headquartered in Mountain View, California.

A quick glance at the EVA metrics reveals that Intuit boasts strong double-digit EVA Margin and ROC figures, which are telltale signs of a high-quality business.

Source: ISS EVA, The FALCON Method

We believe the firm’s flagship specialized software solutions, QuickBooks and TurboTax warrant a wide-moat rating. These make up over 70% of its top line and the overwhelming majority of the EVA generation.

QuickBooks, the bookkeeping tool, is the undisputed leader in the U.S., ruling with an 80% share of the small business accounting software market and a total subscriber base of almost 6 million accounts. Intuit is also the undisputed leader of the online DIY tax preparation market, commanding a 60%+ share. On top of that, the firm’s TurboTax Live, an assisted solution, serves as a further differentiator compared to its peers, where customers can access a tax professional to guide them through the filing process. Growing rapidly, this has become a billion-dollar business within Intuit in just a few years.

As for growth prospects, TurboTax operates in a mature market (with the number of U.S. tax filings staying roughly flat over the past decade), while QuickBooks is still in the early innings of growth (serving a little shy of 6M accounts with a total addressable market of 75M small business customers).

There’s nothing wrong with Intuit’s core business, as the capital-light operations gush out lots of cash at great ROC levels. Between 2006 and 2020, the reinvestment rate stood at 15%. However, the new CEO’s tenure brought a swift change in capital allocation policy, and this is where the picture becomes murky. Before that, Intuit had completed only a single billion-dollar deal since its founding nearly 40 years ago. Then, Goodarzi went on an all-out acquisition bonanza in the last few years, scooping up Mailchimp for a hefty ~$12 billion, only nine months after the firm closed the ~$8 billion deal to acquire Credit Karma.

Our judgment regarding these purchases is mixed. Although we understand that there might be some cross-selling opportunities and strategic advantages by combining these businesses, like providing a one-stop-shop solution for SMBs, we don’t think Intuit needed these deals to prosper. Furthermore, the price tags are tough to justify (for instance, Mailchimp was bought at 15 times revenues), and the related share issuances to fund these deals resulted in meaningful dilution to shareholders. Within the EVA framework, the huge added capital charge associated with these transactions causes the EVA Margin outlook to be very blurry going forward.

Regarding repurchases, the firm spent more than $12 billion on buybacks over the past decade, yet the share count has basically stayed the same. We cannot come to grips with Intuit’s share-based compensation expense, as it seems way out of touch. (Buybacks are also far from opportunistic, with management repurchasing $2.5 billion worth of stock in fiscal 2022 at nosebleed valuation levels.)

As for the stock’s valuation, although Intuit loves to tout non-GAAP financial measures, those might be hugely misleading because of excluding the expense of the egregious share-based compensation. The EVA framework remedies this distortion, along with many others.

(Curious why we don’t use the most popular valuation metrics? Find out here!)

Despite the core business appearing to be superior to the market from both a quality and growth angle, even after assuming an EVA Margin rebound over the next five years, the valuation component acts as a meaningful headwind from today’s price level. The chart of 5-year total return potential speaks for itself.

All in all, the stock is too expensive for our taste at the moment.

The verdict

TurboTax and QuickBooks appear to be resilient, wide-moat businesses, with the latter enjoying healthy long-term growth opportunities thanks to a large total addressable market. If only these two units made up Intuit, with a laser-focused management team and meaningful capital distributions thanks to the capital-light model, we would surely be up for the ride at the right price. However, the current management team must prove first that the two “mega” deals were not a mistake at those price tags.

To be clear: there is a sizeable capital allocation risk associated with the current leadership team. Integrating the Credit Karma and Mailchimp deals will require significant time, energy, and resources. Ultimately, the expected synergies and cross-selling opportunities might never materialize or not to the extent that would justify the lofty price tags. If value-destroying acquisitions were to continue, that could put further pressure on Intuit’s EVA Margin (although fancy presentations about deals being “accretive to non-GAAP EPS” may be enough to sell any story on Wall Street).

Intuit’s stock is a comfortable pass for us at the current valuation.

The company ranked 33rd of our 60 EVA Monsters at the time of writing, based on its 5-year total return potential. (Businesses from 12 countries are represented on our EVA Monster list.)

It is safe to say that there are far more attractive EVA Monster stocks to buy in the current market, with the highest-ranking five boasting total return potentials above 16% over our modeled 5-year timeframe. (You can always find the monthly Top 10 in the FALCON Method newsletter along with our entry price recommendations.)

Want to learn more about our ranking methodology? Start with this blog post!

Are You Guilty of This Common Investment Mistake?

Let me share one of my favorite stock market-related analogies. A middle-aged woman is walking through Central Park, and she has a very active dog with her.

My Hungarian vizsla (Lara) would fit well in this story. Here she is to help you imagine the story.

If you just looked at the lady, you would notice that she is taking normal steps, going in a straight line, walking upright at a moderate pace. Nothing exciting, indeed.

Now let your eyes pan down a little bit, and look at the dog. The vizsla is going crazy. It is chasing birds, digging up clumps of mud, running at trees, and peeing all over the place.

As you may have guessed, the dog is the stock market, and the woman is the economy.

So if you’re watching the dog (the more entertaining stuff), you’re losing sight of the economy (the underlying business performance that determines values in the long run). As long as you can’t get your eyes off the dog, you’re observing the manifestation of hundreds of millions of people’s greed and fear, their buying and selling. But you’re not watching an actual representation of how the economy is doing, and this is a crucial point to keep in mind.

That said, under normal circumstances, the dog periodically checks where the woman is and what direction she is taking. So the dog and the lady, or the stock market and the economy, are somewhat connected, but they most certainly do not look the same or act the same, even if they are walking in the same direction.

Looking at this relationship, sometimes it seems as though the dog has completely lost interest in the woman; it runs far ahead and doesn’t even seem to care that the woman may need to take a break to catch her breath. Make no mistake; the dog still needs the lady; their connection may only loosen temporarily, so the question is where the two will meet again. The dog may choose to sit down or sniff around while staying in the same place (stagnating stock prices) until the woman catches up, or it can run straight back to her (falling stock prices).

Nobody knows how the next chapter of the story will unfold, but pundits would certainly not bet on an outcome where the middle-aged woman could sprint to catch up with her agile dog. That would be impossible with a vizsla, believe me. (Lara was clocked running at ~40mph, which is 60+ km/h.)

The economy, the underlying business performance, tends to move slower than the stock prices. As Joel Greenblatt says:

“Prices fluctuate more than values—so therein lies opportunity.”

When the dog is far ahead of the woman (prices are way higher than intrinsic values), value-conscious investors find hardly any opportunities and tend to underperform until the pair are reunited.

In fact, a value investor’s market would be where the dog is left behind sniffing while its owner is marching ahead at a steady pace.

If you think this has nothing to do with investing, you can check out how even the world’s most reputable value investor, Warren Buffett, couldn’t outperform the stock market over a 25-year timeframe.

Yes, that’s a quarter of a century, and the period is picked somewhat arbitrarily to illustrate the point that prices and fundamentals can decouple for longer than you’d think. (Note that Berkshire’s performance is measured against the S&P 500 total return index, which assumes that all dividends are reinvested into the index. As Berkshire pays no dividend, this total return index helps us make an apples-to-apples comparison.)

Taking our analogy one step further, if you are the contemplative type like me, you can imagine that thousands of pairs of dogs and owners are walking through Central Park, together making up the whole stock market. A sensible investor’s task is to spot a pair where the dog lags behind, and the owner looks healthy enough to keep walking along.

It’s not an easy job, but that’s what we are helping you with at the FALCON Method using institutional-level data inaccessible to retail investors.

Hand on your heart, are you guilty of just watching the dog?

Take the first step to getting over this costly mistake by learning more about our evidence-based stock selection process with this free report.

Grainger Case Study: The Anatomy of 30% Annual Returns

W.W. Grainger (GWW) first appeared in the FALCON Method newsletter in August 2017 when we bought the stock at $170.35. Fast forward ~5.5 years to March 2023, when we exited this position at $704.88, realizing an annualized total return of 30.0%. This equals turning $10K into $43.4K, including dividends harvested. No victory lap here; I’d rather like to illustrate the thought process behind both the buy and sell decisions to provide some value for thoughtful long-term investors.

What we knew back in 2017

Grainger was a Dividend Champion with a 46-year dividend-raising streak, so it comfortably qualified as a reliable income vehicle.

The stock offered a 3% entry yield, a rare opportunity in historical context.

DIVyld230310

The financial metrics revealed that Grainger was an above-average company, most likely facing temporary headwinds. Mr. Market was quick to write off the firm as Amazon seemed to disrupt its business model. As a reaction, Grainger scaled down the number of stores and ramped up distribution centers to grow their e-commerce business. Management believed their operating margin would decline in 2017 and 2018 but begin to grow again in 2019.

Back then, I wrote: “Given the company’s outstanding relations with its customers and the valuable services it provides, it doesn’t have to be the cheapest to stay alive. While a lot of retailers are currently fighting declining sales and struggling to get rid of their inventories, Grainger’s top line is actually rising each year while the inventory stays virtually unchanged. Demand for the firm’s products is still strong. GWW is the epitome of the selective contrarian buy for me. If you believe its business will not be totally commoditized by Amazon, this is a stock you should definitely own. I foresee an annualized total return between 9-12% in the overly conservative scenarios I examined.”

In hindsight, I was way too conservative with that forecast, but better safe than sorry. My short assessment from the August 2017 issue of the newsletter read: “Whenever Grainger offered a starting yield above 3%, the total returns that followed were extraordinary. Coverage ratios are fine, and even with a temporary (?) slowing growth, this stock can be the cornerstone of a portfolio that focuses on reliable dividends.”

The shareholder yield (the sum of the dividend, net buyback, and net debt paydown) sat at 10.0%, making me even more comfortable with this purchase, resulting in a somewhat oversized position.

shr_yld230310

The Patient Holding Phase

Let’s take a look at how Grainger’s business performed during our holding period.

OP Table

As you see, sales increased by ~50%. What’s much more impressive, though, is the margin performance. At the time of our purchase, the firm could convert 3.8% of its top line into real profits (Economic Value Added, cleared from all accounting distortions, as you can learn here). By the time we sold Grainger, its EVA Margin had shot up to ~10%. The company’s management was right about the margin trajectory.

More EVA production tends to entail higher stock prices, and Grainger didn’t embarrass in this regard. Look at how the red bars increased in lockstep with the company’s market value.

EVC

You can learn more about the Enterprise Value Components from this piece.

Grainger also delivered on the dividend front, announcing annual increases like clockwork.

Ycharts_DIV230310

While all was well on the fundamental side of the business, the stock’s valuation became somewhat concerning as Mr. Market changed his tune on Grainger.

Why we sold

In general, we have two main reasons to sell: (1) the fundamentals don’t work out as expected, so the investment thesis seems broken, or (2) the stock gets overvalued, from which level the forward total return potential becomes muted and the risk-reward characteristics unfavorable.

In Grainger’s case, the first explanation doesn’t apply, as the company grossly outperformed our expectations on the fundamental business performance front. As for the valuation side, at a $700+ level, it became almost impossible to justify holding GWW any longer.

Besides doing our independent EVA-based financial modeling, we also tend to look at external sources before making sell decisions like this. Morningstar considers Grainger significantly overvalued over $635. (This was their one-star price when we sold the stock.) Based on the historical dividend yield profile, one could argue that GWW was a sell above $550. So why didn’t we exit this position sooner?

Because Grainger was a Fallen Angel pick of above-average quality, and dumping such stocks too soon usually comes back to bite you. (Back when we didn’t differentiate between EVA Monsters and Fallen Angels, I sold Microsoft on a historical valuation basis instead of looking at its formidable forward total return potential. Lessons learned. By the way, you can learn about our EVA Monster vs. Fallen Angel classification here.)

Here is what we saw with Grainger at the time we sold:

TR_Chart_jav

The annualized total return potential came in at ~4% over a five-year holding period when risk-free US Treasuries yielded above 4%!

The waterfall charts of our two modeled scenarios show the composition of expected total returns. As you see, Grainger has a ~5% fundamental return potential, while the risk of a margin contraction (from the elevated levels) is far from non-existent. On top of this, the valuation may act as a severe headwind in our conservative scenario and would only slightly contribute to the total return potential in our enterprising scenario. The mid-point total return potential of 4.1% was simply too low to justify keeping GWW in our FALCON Portfolio.

TR_Components

That said, the sentiment can always become more extreme before returning to normalcy. Just look at what happened after we sold Target (TGT) at $175 in November 2020, realizing a ~45% annualized return. The share price promptly shot up to $260 before coming back down to meet up with the fundamentals (or, shall I say, reality?).

TGT_FAST230310

Identifying the tops and bottoms is not the business the FALCON Method is involved in. Fortunately, that is not only impossible but also unnecessary for good investment returns. In fact, you can see from the summary table of our sold positions (as of March 2023) that the annualized return we earned with Grainger was not a one-off.

sold_table230310

Courtesy of FAST Graphs, you can see how all three components of the total return formula worked in our favor with our Grainger investment.

  • Earnings grew threefold (and EVA increased even more, as you could see),
  • we pocketed growing dividends,
  • and the valuation multiple also expanded (i.e., the sentiment got better after Mr. Market realized that Amazon didn’t kill Grainger, but the challenge posed made it a better company).

FAST230310

As a result of all the above, we could generate a market-beating total return with this Fallen Angel of better-than-average quality.

If you liked this piece, you can learn more about the FALCON Method by taking a look at this free report.

Performance Review and Related Thoughts (The First 5.5 Years)

From the Closing Thoughts of the January 2023 FALCON Method Newsletter (published on 08/01/2023)

The numbers are in. As usual, in the January issue, we take a look at how our FALCON Portfolio has performed relative to some benchmarks. To make this comparison fair, we had to ditch Old School Value’s (OSV) calculator and switch to Portfolio Visualizer Pro. While I now consider this latter tool the golden standard of performance evaluation (mainly because of its transparency), OSV’s solution served us well through the years.

The reasons for switching were plenty: (1) Eaton Vance got acquired, and its ticker symbol ceased to exist, which OSV couldn’t properly handle. (2) OTC stocks are not supported by OSV, so we had to find a workaround for including Tencent in our modeled portfolio, just like we had to come up with a creative solution to address the Eaton Vance issue. The more tinkering it required, the less reliable the results became. (3) OSV seems to be applying daily rebalancing when modeling an equal-weighted portfolio, and that frequency is simply unrealistic. (4) Last but not least, dividends are added to portfolio returns in OSV, but it cannot handle dividend reinvestments, which significantly distorts long-term results when compared to total return indexes (that benefit from the impact of continuously reinvested dividends). All in all, Portfolio Visualizer Pro transparently shows that the newsletter’s performance may have been underreported until now, mainly due to reason #4. 

Without further ado, our FALCON Portfolio’s value decreased by 13.2% in 2022, outperforming both the S&P 500 (-18.1%) and the MSCI World (-17.7%). This is no surprise since our defensive strategy tends to lose less when the market falls, thus preserving a higher base to build on once the tide turns. Of course, defensiveness also means we are not capturing 100% of the upside amid euphoria, but the numbers do work out over cycles. (More specifically, we have a downside capture ratio of 96.4% and an upside capture ratio of 98.5%.) Since inception, our newsletter’s equal-weighted portfolio has produced an annual return of 11.0%, compared to the S&P 500’s 10.7% and the MSCI World’s 8.1%. All figures include reinvested dividends. You can see our report card below, showing all our monthly, annual, and cumulative returns. (The numbers speak for themselves; not that I was too interested in the monthly breakdown.)

Click to enlarge!

I consider the interpretation much more important than the outcome, so allow me to spill some virtual ink on this topic. I have long said, and results do prove that our investment strategy is defensive in nature, so we expect to generate most of our alpha during down markets. (Those down markets that have failed to materialize for a while.) Check this chart of annual returns to see what I mean.

Some may argue that our EVA Monster focus tilts us toward a more aggressive approach, and it has most certainly increased our downside capture ratio. Yet I want you to understand that our quality-growth picks are highly profitable companies with enviable market positions. Consequently, we are not investing in your typical speculative growth stock that not only got slaughtered as yields rose but may have trouble regaining footing until turning profitable and cash flow positive. All in all, I’m happy with the blend of two stock types in our portfolio: dividend-paying Fallen Angels and quality-growth beasts that go by the EVA Monster name.

When it comes to performance evaluation, a not-too-often quoted piece by Bill Miller may be thought-provoking. In his 2005 letter, Miller writes: “You are probably aware that the Legg Mason Value Trust has outperformed the S&P 500 index for the past 15 calendar years. That may be the reason you decided to purchase the fund. If so, we are flattered, but believe you are setting yourself up for disappointment. While we are pleased to have performed as we have, our so-called ‘streak’ is a fortunate accident of the calendar. Over the past 15 years, the December-to-December time frame is the only one of the twelve-month periods where our results have always outpaced those of the index. […] We would love nothing better than to beat the market every day, every month, every quarter, and every year. Unfortunately, when we purchase companies we believe are mispriced, it is often difficult to determine when the market will agree with us and close the discount to intrinsic value.” The only reasonable goal can be to construct an investment portfolio that has the potential to outperform the market over entire business cycles.

And were I not a newsletter provider, I wouldn’t even bother about outperforming any benchmark. By all means, please read Morgan Housel’s “Internal vs. External Benchmarks” post to get the message. Just a short quote, as I guess that 99% are not clicking on any links: “The only way to consistently do what you want, when you want, with whom you want, for as long as you want, is to detach from other people’s benchmarks and judge everything simply by whether you’re happy and fulfilled, which varies person to person. I recently had dinner with a financial advisor who has a client that gets angry when hearing about portfolio returns or benchmarks. None of that matters to the client; all he cares about is whether he has enough money to keep traveling with his wife. That’s his sole benchmark. ‘Everyone else can stress out about outperforming each other,’ he says. ‘I just like Europe.’ Maybe he’s got it all figured out.”

Turning to the macro picture, 2022 was undeniably dominated by the Federal Reserve’s actions to fight inflation. The latest 0.5% increase was anticipated, but the expected terminal rate of 5.1% (equivalent to a target range of 5%-5.25%) by the end of 2023 moved up from the 4.6% projected by the Fed back in September. As things stand, seven central bank officials expect rates to go even higher, with two seeing rates topping out at 5.75%. One hawkish official expects rates to remain at that level through 2025. Chairman Jay Powell said it was impossible to know if a recession would occur, and if one does, how long it would last or how deep it would be.

I believe the stock market has been focusing on an optimistic inflation scenario throughout 2022, yet defensive sectors have performed well. This may change quickly if the outlook begins to improve. I read that in the latest Barron’s poll of Wall Street strategists, not one 2023 target suggests a loss in the S&P 500 over the coming year. The average year-end target for 2023 is above 4,200, with both the median and average target implying a 2023 total return of over 10% for the index. I’d be itching to hear the expert explanations, given that valuations at the top in early 2022 were higher than those of 1929 and 2000, interest rates are significantly higher than any period from 2009 to 2022, and inflation is higher than any point in the last 50 years. With that being said, our FALCON Portfolio is an all-terrain vehicle that will serve us well whatever comes in 2023 and beyond. Be patient, stick to the plan, and enjoy every minute of the journey!

New to the FALCON Method? Check out how our investment process works: How to Build an Evidence-based Stock Selection Process in 7+1 Steps

[Case study] How I made 27% and 39% annualized returns – and why I sold the latter stock

I’m a practical guy, so let’s start with two case studies:

These will make it easier to understand the logic behind the two different kinds of stocks: Fallen Angels and EVA Monsters.

(If you haven’t already, please read my articles about commonly used multiples and EVA, the most demanding profit score.)

I bought Lowe’s (LOW) stock on August 4, 2017, at $78.37. As things stand, this investment has produced a ~27% annualized return in 4.5 years, and I’m still holding the shares.

The second example is Cummins (CMI), which I bought on October 26, 2018, at $128.77 and sold at $265 on March 5, 2021, pocketing an annualized return of ~39%.

Source: FAST Graphs

There was a reason for selling the latter stock while holding on to my Lowe’s position. You’ll get it very soon.

Although the returns look great in both cases, Lowe’s and Cummins are two very different types of investment, and this is exactly what I’d like you to understand.

Why were these returns so high?

When you hold a stock, you can make money from two sources: the price can go up, and you can collect dividends. There is no other way!

To take it a step further, we can break up the stock appreciation part into two components: earnings growth and price-to-earnings (valuation) expansion/contraction.

So the comprehensive total-return formula looks like this:

Total return = Earnings growth + price to earnings expansion + dividends

Now back to the question: what drove those eye-catching returns in the two examples?

In Lowe’s case (the stock I held onto), the earnings per share almost tripled, while the PE multiple actually contracted somewhat (acting as a headwind), and we harvested growing dividends along the way.

Here is how the combination of these factors worked: (Adding up the first 4 columns equals the total value)

It is obvious that the company’s earnings growth drove my investment return with Lowe’s. Now let’s see how the Cummins position worked. (The stock I sold.)

While Cummins’s earnings grew nothing during my holding period, I received ~9% of my invested capital in the form of dividends in those ~2.5 years, and the expansion of the valuation multiple did the heavy lifting to contribute the lion’s share of my returns.

Jumping ahead…

What on earth could have made me hold on to my Cummins stock after the valuation corrected upwards while the company didn’t show any sign of growth?

The best part has already happened!

The valuation became high, and without the business growing, I could not expect exceptional returns in the future.

On the other hand, selling Lowe’s would be a costly mistake even at a seemingly stretched valuation (high PE). And this gets us to the point that not all stocks are equal, and different types may need different treatment when it comes to analysis and decision-making.

Read on, and get the insight that took me 10+ years to grasp…

EVA Monsters and Fallen Angels

In pursuit of maximizing total returns, two segments of the stock universe are of exceptional importance, which we simply refer to as “EVA Monsters” and “Fallen Angels.”

The fundamental return of every stock (excluding the effect of valuation) is composed of:

Fundamental Return = Profit (EVA) CAGR + dividend yield + share count reduction

In the case of the aforementioned two categories, the composition of fundamental return is very different:

1. EVA Monsters:

These are high EVA-growth companies, where the majority of our fundamental return stems from future growth in EVA. Some of these companies are major repurchasers of their shares, and most pay no dividends since they have wonderful reinvestment opportunities.

2. Fallen Angels:

These are mature businesses that have stable EVA generation capability but lackluster growth. Most have a sizable dividend payout, potentially enhanced by share repurchases.

While both types of investments can yield handsome results, it is readily apparent that “EVA Monsters” have a higher fundamental return than “Fallen Angels” because they possess much better growth characteristics.

Why is fundamental return important? Because the longer you hold a stock, the closer your return will get to this fundamental return.

As Charlie Munger put it:

“Over the long term, it’s hard for a stock to earn a much better return than the business which underlies it earns.“

In short: when our aim is to hold a stock for decades, we want “EVA Monsters” in our portfolio.

Once we have laid this foundation, we can introduce valuation as the last missing piece of the equation. Let’s see the full investment thesis behind both groups:

Total Return = Fundamental Return + Change in Valuation

In the case of “Fallen Angels,” sentiment change is the primary source of total return. Since reversion to the mean is a one-trick pony, the sooner it happens, the higher our annualized return.

The most dangerous pitfall is that this reversion takes too long to happen (if at all), dampening our total return since there is no growth to compensate for the time elapsed.

A company can offset some of the “waiting time” with a handsome dividend payout, assuming the dividend is sustainable and that the EVA generation is stable.

Simply put: when we buy “Fallen Angels,” we want a huge discount to fair value coupled with a short holding period, hoping for a quick rebound in valuation.

Until then, we collect the dividends, and when the reversion takes place, we sell at fair value (the sooner, the better).

In a nutshell, we don’t want to be stuck holding a “Fallen Angel” for too long unless it turns into an EVA Monster along the way (which is rather unlikely but cannot be ruled out).

Monitoring these positions closely is absolutely essential since some of them may turn out to be value traps while others may transform into EVA Monsters.

When it comes to “EVA Monsters,” we want to buy companies with lots of EVA growth left in the tank, at a reasonable entry price and hold them for the long run.

The primary pitfalls are that we either overpay for growth or the forecasted growth does not materialize to the extent we expected. Both scenarios would sink our total return potential.

Thus, we have to leave a buffer in our purchase price in case some of the EVA growth we had anticipated does not materialize, which is painful in not one but two ways:

  • the significantly dampened fundamental return
  • and the corresponding change in market sentiment (that affects the valuation component of the equation), to adjust for lower future growth.

Back to the case studies

While the quality and growth factors played the most important part with EVA Monsters, it is the valuation that drives returns with these once-beloved dividend darlings that landed in the bargain bin. This describes perfectly why we call this category Fallen Angels.

As a reminder of our case study, you can see how different components of the total return formula played the key role in Lowe’s and Cummins’ case, where the former classifies as an EVA Monster while the latter was a Fallen Angel investment.

I hope you see that this type of Fallen Angel stock that offers hardly any growth but pays reliable dividends must be analyzed differently from the EVA Monsters that you can hold for decades for their exceptional fundamental business performance.

Numbers clearly show that one shouldn’t use the same ranking and analysis framework for Fallen Angels and EVA Monsters since

  • different components of the total return formula tend to play the most important part with these categories and
  • these disparate types of investments work on very different timeframes.

That said, I’m yet to see another newsletter or info service that treats the EVA Monster and Fallen Angel categories separately.

Long story short: what we do is put together the EVA-based financial models for those Fallen Angels that rank highest based on our composite Angel Score. (Modeling and keeping all the data up-to-date wouldn’t make sense with all the ~300 companies that could qualify as Fallen Angel candidates based on their dividend history, so we only put in the work with the highest-ranking names.)

If the total return potential warrants, Fallen Angels can land on the FALCON Method newsletter’s Top 10 list (after careful qualitative assessment, of course).

That said, if a Fallen Angel and an EVA Monster provide identical total return potential, buying the EVA Monster is a no-brainer choice.

The problem with Fallen Angels is that the valuation usually reverts to the mean within 2-3 years (as Joel Greenblatt teaches at Columbia Business School), so you have to sell your positions and reinvest the capital.

Here is how Josh Tarasoff of Greenlea Lane Capital Management describes this problem: “I was noticing that investors are typically under intense time pressure to find new ideas. The math is simple: a portfolio with two dozen stocks and an average holding period of two years requires one new, market-beating idea each month, without end.

And this example involves a relatively concentrated and low-turnover portfolio by the standards of the industry: most investors need to keep up an even faster pace. The necessity to be continuously on the verge of some great new idea sows an endemic hurriedness that can be seen on people’s faces and heard in their voices. This struck me as unhealthy for decision making (and perhaps even unhealthy, period).”

I’ve been living financially free since I turned 33, and having experienced the continuous pressure of Fallen Angel investing that Tarasoff writes about, all I can say is “thanks, but no thanks.”

Investing in EVA Monsters is the way to go for the true buy-and-hold investor, and Fallen Angel situations are only interesting when they provide extraordinary opportunities.

We keep our eyes open and systematically comb through the list of dividend payers to identify such situations.

Selling rules are different

For those who understand the role and importance of the various total return components with EVA Monsters and Fallen Angels, the simple rules on when to sell will not come as a surprise.

The number one insight in a nutshell

You saw that the expansion of the valuation multiple drives returns with Fallen Angel stocks. This expansion is a one-time event: the multiple will revert to its mean once and will not keep climbing further for decades.

Once the mean reversion happens, only the remaining components of the total return formula work for you. Simply put, you will reap the returns produced by the underlying company’s fundamental business performance (the combination of EVA growth, dividends, and share repurchases), and this return tends to be mediocre with most Fallen Angels.

Conclusion: selling Fallen Angel stocks once the valuation expansion happens is the reasonable decision.

With EVA Monsters, on the other hand, the growth part of the total return formula plays the central role. The implications of this difference are crucial. EVA growth is not a one-time event but can continue for decades if the company’s competitive position and growth opportunities allow it to reinvest a big part of its cash flows at high rates of return.

Conclusion: As long as the “Monster characteristics” of the business are intact, you have every reason to hold on to the EVA Monster stocks, (almost) regardless of valuation.

As you saw, with Fallen Angels, once the valuation multiple reverted to its mean or even overshot to the upside, there is not much one should wait for with selling.

You can call on the dividend yield theory or use valuation metrics like the NOPAT yield or Future Growth Reliance to get a picture on when to sell.

As for EVA Monsters, a “longer leash approach” is warranted since the majority of our returns stem from the growth component (the combination of the reinvestment rate and the return on that newly invested capital), and the longer the holding period, the less important the role of the valuation multiple becomes.

In summary: we keep our Fallen Angel positions on a relatively short leash and sell when they approach fair value, while EVA Monsters need that kind of extendable, longer leash since the valuation multiple is not the major part of our total return as long as the “Monster characteristics” remain intact.

Makes sense? You can learn more about the FALCON Method here and see how you can make institutional-level decisions for a price that is affordable to individual investors.

Our subscribers get the best of both worlds within the same service, so they can buy the best Fallen Angel and EVA Monster stocks as well.

Ready to take the guesswork out of investing and get to the next level? 

Join our free webinar and upgrade your stock selection process with cutting-edge cata!

My secret sauce to dividend investing, to ramp up my returns…

Having a steadily rising dividend attracts investors and builds trust in the company.

Shareholders tend to interpret increasing dividends as a sign of strong financial health.

Most of them think, “As long as the dividend is growing, everything must be okay.”

This is PLAIN WRONG! Let me show you why…

Confessions first: I used to be a devoted dividend investor. So much so that I wrote a book on the topic which sold 10,000+ copies and became a best-seller in my country.

By teaching dividend investing in both personal and online formats (since 2014) and investing all my money in dividend stocks, my understanding got deeper and deeper… and this started to cause some inner conflicts around 2020.

By then, I had firsthand experience that income-focused investing is a suboptimal strategy when it comes to maximizing one’s future purchasing power. I wholeheartedly agree with Warren Buffett’s simple definition, which says:

“Investing is forgoing consumption now in order to have the ability to consume more at a later date.”

Dividend investing has some undeniable handicaps that make it virtually impossible for the followers of this approach to maximize their total return and thus their ability to consume much more at a later date.

Don’t get me wrong! As long as you only want reliable income and are willing to sacrifice a (considerable) slice of your future purchasing power for this reason, income investing can serve you well. I’d like to show you the factual reasons that gave me a new perspective on dividend investing.

We all have the tendency to search for and favor information that confirms or supports our prior beliefs, and we tend to disregard the info that contradicts our beliefs and values. (This is called confirmation bias.)

I know all too well that reading stuff that questions how you were investing up to this point is very uncomfortable.

Been there, done that… as a best-selling author. That said, if you remain open to what I’m going to share about the importance of the companies’ capital allocation and the proven drivers of shareholder value, you can become a better investor.

All I ask you is to put your beliefs aside while reading this piece and objectively evaluate the findings supported by evidence and real-life examples. This is exactly how I became a more accomplished investor…

The dividend promise is a trap

Paying a dividend is a choice made by the management about how best to manage the owners’ cash. (Yes, being a shareholder means that you ARE an owner!)

The dividend is just one option to use that money, as you can see below.

A good dividend is one that’s paid out with money the CEO cannot efficiently allocate to growth. What does this mean?

As long as the management can find opportunities to put the money to work and earn a return on this newly invested capital that surpasses the cost of this capital (more on this later), paying a dividend is not the best choice they can make.

Income investors typically don’t think this way. They tend to favor those companies which have been paying dividends for a long time, without interruption and reduction. 

Such a policy seems to all but guarantee a reliable and growing passive income stream; this is why the Dividend Champions (firms with 25+ years of consecutive dividend increases) are so widely-followed and acclaimed. However, there is no free lunch…

Look at the following example:

Let’s say a company produces $1M this year that it could use freely since its maintenance costs are already covered.

This company may have a growth project that would require the $1M and could reasonably generate a return of 30%. As long as the firm’s cost of capital is below that 30% (which is true for almost all U.S. companies), investing in this project is a no-brainer!

Okay, but what if this company is a revered Dividend Champion that has been paying rising dividends for 25+ years?

Paying that promised dividend would cost $700K this year, so either the promising growth project gets turned down, or the dividend promise needs to be broken. The CEO of a Dividend Champion would risk his job by infuriating the shareholders, so the dividend remains sacrosanct.

The CEO may not be smiling all the way to the bank while cashing his paychecks because he knows that a suboptimal decision had to be made to appease the short-term thinking crowd of shareholders.

Capitalism is cruel, but it works!

What do you think happens to companies that turn down such investment opportunities for short-term benefits? They get hit hard by competitors whose capital allocation is not shackled by the “unbreakable dividend promise.”

As Danielle Town writes in her book (entitled Invested):

“Having a steadily rising dividend […] puts the company into what is essentially an implied contract of expectations between the company and its shareholders that, once entered, the company can never breach: a Dividend Contract of Expectations. The agreement in a Dividend Contract of Expectations is that the company will continually pay an increasing dividend, and shareholders will interpret that payment as a sign of the company’s strong financial health.”

The unbreakable promise of ever-increasing dividends makes reasonable capital allocation very difficult, if not impossible.

The point I’d like to make is this:

Dividends, particularly large, steady dividends, are to be viewed as if you were the business owner who wants the best possible return on their investments.

It shouldn’t matter whether the money is coming from dividends or such highly value-adding growth projects that only exceptional companies can pursue. (More on this later.)

Capital allocation matters! Where are the dividend darlings?

If you want to become a better investor, reading William Thorndike’s “The Outsiders” book would be an excellent investment of your time. Thorndike examines eight CEOs who created enormous value for their shareholders by excelling at capital allocation.

The conclusion may be troubling to devoted dividend investors who are not open to revisiting their approach:

“Each [of the CEOs profiled in the book] ran a highly decentralized organization; made at least one very large acquisition; developed unusual, cash flow–based metrics; and bought back a significant amount of stock. None paid meaningful dividends or provided Wall Street guidance. All received the same combination of derision, wonder, and skepticism from their peers and the business press. All also enjoyed eye-popping, credulity-straining performance over very long tenures (twenty-plus years on average).”

All the extraordinary capital allocators followed a virtually identical blueprint: they disdained dividends.

Wait a minute! Where did those eye-popping shareholder returns come from then?

When you hold a stock, you can make money from two sources: the price can go up, and you can collect dividends. There is no other way!

To take it a step further, we can break up the stock appreciation part into two components: earnings growth and price-to-earnings (valuation) expansion/contraction.

(I would rather use EVA, which stands for Economic Value Added, instead of earnings, and forget the highly popular PE multiple altogether, as you can read in this article.)

However, let’s stick with the widely-known metrics for now, to make things easier to understand. The comprehensive total-return formula looks like this:

Total return = Earnings growth + price to earnings expansion + dividends

It goes without saying that the higher the dividend yield, the less the other engines of total return must work. Dividend investors love high-yielding stocks!

Let me invite you to a thought experiment…

Say the treasury rates are at ~2%, and the S&P 500’s dividend yield is below 1.5%. (None of these are mouthwatering figures for income investors, and this is not science fiction… we’ve seen this movie!)

Let’s say that MakeYouRich Inc. is paying a hefty 7% dividend yield in this kind of environment. Why do you think the market prices this stock in a way that its dividend yield (the forward 12-month dividend divided by the stock price) can be this high?

There are two usual reasons:

(1) The current dividend is not sustainable because the company doesn’t make enough cash to cover it in the long run, or…

(2) The business has hardly any growth opportunities, so you will most likely not earn any more than the dividend.

Neither of these reasonable scenarios is too attractive for thoughtful investors who see the whole picture instead of focusing only on the dividend part of the total return formula.

See what happens when a dividend darling breaks its promise!

Kinder Morgan (KMI) was a high-yielder, one of the income investors’ darlings. (Disclosure: I was one of them at that time.)

The company boasted that it was the only name on the Fortune 500 list that provided guidance on its dividend. Too bad that the dividend was not sustainable, and investors who relied on that income lost their faith and dumped the stock once it became clear.

As the 75% dividend cut was announced, the stock price fell from $40+ to the low-teens. The phrase “getting Kindered” was born, meaning that someone suffers a significant dividend cut and the ensuing loss of capital.

Believe me; you never want to get Kindered! I learned this the hard way…

Here’s how you could invest more wisely

First and foremost, let go of your dividend fixation. It makes no difference whether a company pays a dividend as long as they are doing their best on the capital allocation front.

As a reminder:

Total return = Earnings growth + price to earnings expansion + dividends

Let’s focus on the earnings growth component now. I’ll show you how this part can fool investors as well, and then you’ll see the solution that works very well for me.

Take a look at Whirlpool between 2013 and 2019!

As you can see, earnings per share (the dark green area) shows a nice increase almost every year between 2013 and 2019 (from $10 to $16), yet the stock price (the black line) is moving sideways. So much for earnings growth affecting the price and shareholders’ returns, you might say…

Until you see this next picture:

Simply put, EVA is the company’s real profit after correcting for all accounting distortions and applying the true cost of capital to all the money used by the business. (Read my explanation of EVA here.)

While EPS exhibited growth, the increase in EVA (real value creation) was not that clear, to say the least. This is a classic example of where EVA and EPS differ, and EVA wins the argument.

While growth in the widely-followed EPS (earnings per share) metric doesn’t essentially result in a growing stock price, EVA (Economic Value Added), which is an institutional-level metric, remedies most of the problems and thus comes pretty close to being a perfect indicator for long-term investors with a business owner mentality.

I’m not the one who invented EVA, so instead of talking it up, even more, I’ll let the numbers do the talking.

Bennett Stewart writes in his “Best-Practice EVA” book that running the correlation across all stocks, it is about 82 percent, meaning that EVA and expectations about future EVA generation drive shareholder returns. That said, I came across a white paper later, which revealed an even stronger relationship between the EVA-based shareholder return predictions and the actual shareholder returns. (TSR stands for Total Shareholder Return in the chart below.)

The Link Between TSR and EVA Source: The Link Between TSR and EVA, Bennett Stewart

When it comes to the growth component of the total return formula, there’s no question that we really should focus on EVA growth.

That said, EVA grows when the company invests its incremental capital at a rate that surpasses the cost of that capital. So EVA essentially grows as a result of wise capital allocation. All roads lead to Rome… to the same conclusion, I mean.

Want to dip your toe in? I’ll show you my journey

I’d like to make it clear that my transformation from a dividend investor to an all-round quality-growth investor took years. Btw. I seem to be no exception, as reading Fundsmith founder Terry Smith’s “Investing for Growth” book would reveal to you that even this star money manager re-evaluated the role and importance of dividends as the years went by.

There’s absolutely no problem with starting out by investing in reliable dividend payers! BUT you should keep track of where your returns are coming from…

AT&T vs. Lowe’s: 2 Dividend Champions in totally different leagues!

AT&T used to be the darling of dividend investors as its name became synonymous with “high dividend yield, delivered reliably.” Lowe’s, on the other hand, has a 50+ year streak of dividend increases, but its stock almost always qualified as a low-yielder. See how investing in these two names for 10 years could work out.

While high-yielding AT&T’s price barely moved (at least not in the right direction), Lowe’s price chart shows a nice and steady increase. You can see the explanation below…

While Lowe’s is firing on all cylinders and is producing more and more EVA, AT&T’s EVA was going sideways (or down) most of the time within the 10 years. Wherever EVA goes, the stock price follows as you saw the quantitative proof.

AT&T’s shiny yield was not worth tying down your capital, but as long as you keep a record of the underlying factors of total return, you could learn a valuable lesson: the dividend is not everything; thoughtful investors must also focus on where the company’s real economic profit (EVA) is going.

Noticing this, any dividend investor can take the necessary steps to become more successful. Now let me call on Charlie Munger to highlight the most important message that every long-term investor must print out and keep in mind.

It’s the quality that really matters!

Munger said: “Over the long term, it’s hard for a stock to earn a much better return that the business which underlies it earns. If the business earns 6 percent on capital over 40 years and you hold it for that 40 years, you’re not going to make much different than a 6 percent return – even if you originally buy it at a huge discount. Conversely, if a business earns 18 percent on capital over 20 or 30 years, even if you pay an expensive looking price, you’ll end up with one hell of a result.”

The message is clear: 

In the long run, it’s the business quality that drives returns, not the valuation you pay! 

I hope you wanted to ask, “what about the third and last component of our total return formula, the valuation multiple?”

Let me show you an example to highlight that this sentiment-driven component is only relevant in the short term.

Over 10+ years, the investment performance is determined by the rate of return at which the company can employ its capital and the firm’s reinvestment opportunities.

AN EYE OPENING MATH EXAMPLE:

Company A can make a 30% return on all the capital it employs (this is its ROC, which stands for Return on Capital) and can reinvest 60% of its profits every year (this is the reinvestment rate).

If this company starts with $1M capital, it will produce $300K in profit by the end of the first year. $180K of this profit gets reinvested while the remaining $120K lands in the cash coffers. Here is how the math would look over a 40+ year timeframe:

Company B operates with a 20% ROC and a 20% reinvestment rate, so the math would work in the following way:

Let’s assume first that the market is valuing both firms at 20-times earnings, and this multiple stays constant over the whole 40+ years. (I know this is an unrealistic assumption, but bear with me, as I’d like to point out a very important thing before we introduce the changes of the valuation multiple.)

The Enterprise Value is simply the sum of the equity value (20-times profits) plus the amount of surplus cash. Here is how things would work out:

Investing in Company A for 40+ years would give you an annualized return of 18.3%, while your return with Company B would be 5.5%. (This is simply the compound annual growth rate between the starting and ending Enterprise Values.)

It is quite telling how, by every passing year, these annualized return figures converge toward the level that multiplying the ROC by the reinvestment rate would give you. (In the A case: 60% x 30% = 18%; in the B case: 20% x 20% = 4%.)

This is essentially the math behind Charlie Munger’s quote, although he used a 100% reinvestment rate to illustrate his point more simply. (But no company operates with a 100% reinvestment rate, so our example is more realistic.)

Now on to the part that the valuation multiple can play in determining your investment returns.

Let’s assume that you invested in Company A’s stock at a hefty valuation of 20-times earnings and that multiple contracted to 8 by the end of the 40+ years. Your annualized return would still come in at 16%, despite the heavy valuation headwind.

On the other hand, if you managed to buy Company B’s stock on the cheap, at 8-times earnings, and that multiple grew to 20 by the end of the 40+ years, your annualized return would still only hit 8%.

Conclusion: it is the profitability of the business (ROC) and its growth prospects (the reinvestment rate) that drive returns on a multi-decade-long horizon. This is not fiction but pure math.

I will let the numbers do the talking…

It’s funny to see that several people call themselves long-term investors, yet most of them keep asking the wrong question: “Is that stock cheap?” instead of the correct one: “Is the underlying business of exceptional quality?”

As Joel Greenblatt teaches at Columbia Business School’s Value Investing courses (which I completed), once you find a stock that looks undervalued, it usually takes 2-3 years for the valuation multiple to revert to its mean if you were right about the company’s fundamentals. 

Once the valuation multiple expansion has happened, that coiled spring effect is gone: that component of the total return formula won’t keep working for you… so you would have to make do with the EVA growth and dividend components.

Basically, as Munger says, you would earn what the business earns on its capital. How do you think the revered Dividend Champions fare in this regard?

The 3-year average ROC (return on capital) numbers of 141 Dividend Champions have a median of around 10% and a mean below 13%. Do you want a benchmark? How about using the universe of quality-growth stocks (we like to call EVA Monsters at the FALCON Method)?

Most Dividend Champions are not in the same league as the quality-growth beasts. Here are some names and ROC numbers from the latter group to illustrate this point:

Not to mention that the companies in our carefully selected global EVA Monster universe (there are ~50 at the moment) have far better and more reinvestment opportunities than most of the Dividend Champions. 

If you combine the higher return on capital and the higher reinvestment rates, you must realize that holding a quality-growth company for the long run offers much more attractive total return potential than the beloved Dividend Aristocrats.

In fact, numbers do the talking…

Falcon Method Vs market

From this perspective, dividend investing is far from the “single best strategy” many want you to believe.

The sweet spot, which makes your start (or transformation) easier

Let me reward those few who are still with me with a piece of great news: There are some reliable dividend payers who also qualify as EVA Monsters, so they can be great investments from both an income and total return perspective.

While the full list of such stocks is reserved for the FALCON Method newsletter subscribers, BlackRock (BLK), Lowe’s (LOW), and Microsoft (MSFT) come to mind as great examples.

The existence of such companies means that dividend investors can dip their toes into the quality-growth investing realm without sacrificing their dividend checks.

If you prefer to take this route, I kindly ask you to keep track of these EVA Monster positions in your portfolio and evaluate their performance separately, compared to the other parts of your portfolio after ~5 years. My bet is that you’ll be converted much sooner than that…

Once you see the results, you’ll have firsthand experience and thus won’t discard the notion that dividends are not needed for stellar returns as long as you know how to spot the exceptional quality-growth names in the market.

This was a life-changing realization for me (that took way too long, in hindsight)! Hopefully, I could help speed up the process in your case and thus increase your lifetime investment returns.

Quality never goes out of style… Look at this impressive combination!

If you are a long-term investor, the following chart should both be thought-provoking and mouthwatering to you.

The chart shows the excess returns of the MSCI World Quality Index, which is the amount by which this Quality Index beats the core MSCI World Index.

Let me translate: Over the last 25 years, there has never been a rolling 120-month (ten-year) period when quality has not performed as well as or better than the MSCI World Index.

Now that you know the underlying logic (that ROC and reinvestment rate drive long-term returns) and see the proof that this quality-focused approach is indeed working, what reasons do you have to stick with mediocre dividend payers?

Add to the mix that top-quality businesses can better withstand inflation as they have the ability to price their highly desirable products, services, and assets to preserve their profitability in an inflationary environment.

In his 2021 annual letter to investors, Fundsmith’s Terry Smith also emphasized that “the initial impact of input cost inflation is not on consumer prices but on company profits. All companies are not equal in this regard.”

You can check the math below with a real-life example…

The conclusion is clear: from a fundamental respect, quality companies are likely to be better able to weather inflation. One more reason (besides the proven outperformance), and I’m not finished yet.

Last but not least, holding shares of exceptional businesses for decades can give you peace of mind that no other investment strategy could match!

Remember: when you hold stocks in mediocre companies, you really should get rid of them every 2-3 years once the valuation expansion has happened. As Josh Tarasoff says, “I was noticing that investors are typically under intense time pressure to find new ideas.

The math is simple: a portfolio with two dozen stocks and an average holding period of two years requires one new, market-beating idea each month, without end.

And this example involves a relatively concentrated and low-turnover portfolio by the standards of the industry: most investors need to keep up an even faster pace.

The necessity to be continuously on the verge of some great new idea sows an endemic hurriedness that can be seen on people’s faces and heard in their voices. This struck me as unhealthy for decision making (and perhaps even unhealthy, period).”

Owning the good stuff for decades is less stressful, provides higher returns, and is a great hedge against inflation.

This combination got me hooked once I understood all the underlying evidence.

And you don’t even need to completely give up the dividends since there is an intersection of the income-focused and quality-growth approaches, thanks to those dividend-paying EVA Monsters.

So what now?

While I keep holding some of my dividend stocks, most of my new capital goes into EVA Monster names these days.

My love affair with income investing is not totally over, but I am only willing to commit serious capital to a dividend stock when its total return potential looks competitive in comparison with the EVA Monsters. (This only happens when a “dividend darling” loses Mr. Market’s affection and temporarily lands in the bargain bin.)

At the FALCON Method, subscribers of our monthly newsletter service get the best of both worlds.

Whenever a reliable dividend payer’s stock gets marked down so much that its total return potential becomes attractive, we are pouncing on that opportunity; otherwise, our in-depth modeling of ~50 global EVA Monsters gives us a valuable ranking to focus our attention and money.

Ready to take the guesswork out of investing and get to the next level? 

Join our free webinar and upgrade your stock selection process with cutting-edge cata!

How to Build an Evidence-based Stock Selection Process in 7+1 Steps

It was one of the most exciting days since I started investing…

My palms were sweating; I felt like my heart would jump out of my chest…

I was heading to the Florida office of Chuck Carnevale, the co-founder of FAST Graphs (the “Fundamentals Analyzer Software Tool” I mainly use for illustration purposes).

By then, Chuck had half a century of investment and wealth management experience, so I was very excited to pick his brain.

We sat down, and he casually launched the FAST Graphs website, entered a stock ticker, and showed me some fundamental data on a chart. Then he popped the question:

“Would you invest in this company?”

I blurted out an instant, “No way!”

Then I went on to elaborate on the pitfalls of analyzing cyclical stocks like the one he picked to test me.

I’ll never forget Chuck’s face lighting up when he said, “Now we’re talking!”

He became enthusiastic because he realized we would spend the rest of the hour talking seriously about investing in good businesses instead of speculating on stocks.

I tell you this story because my process will be of great value to those who are not “playing the stock market” but want to own stocks as business owners…

If you consider yourself a long-term stock investor, then this process can be very valuable for you.

To fully understand the steps below, first, you need to have a deep understanding of these basics:

  1. Accounting numbers are not meant for investors, and commonly used multiples are dangerous to use. (Read my article about it here!)
  2. You need better quality data measuring the real economic profit of the business. This is EVA, the most demanding profit score that remedies accounting distortions and calculates with the true cost of capital. (Read about it here!)
  3. You have to understand the difference between “Fallen Angel” and “EVA Monster” stocks because these two categories must be analyzed in different frameworks. (Read about it here!)

I have become a successful investor through a lot of learning, and I made tons of mistakes you don’t have to.

My investment results started to become consistently good after I could clearly describe what I was doing as a structured process.

This is not as hard as it may seem, so let me show you the exact 7-step process I am using today with my own money to pick (and sell) stocks.

It took me years to perfect these steps, and I am sure you will be greatly rewarded if you can follow them.

(And just to make it clear: this whole process is included in The FALCON Method Newsletter service, so this is the work you can skip just by subscribing here.)

Let’s see the steps of The Falcon Method…

Step#1: Screen for Top-Quality

A picture is worth a thousand words, and I’m an evidence-driven guy, so I invite you to take a look at the following chart first.

You can see the excess returns of the MSCI World Quality Index, which is the amount by which this Quality Index beats the core MSCI World Index.

Let me translate: Over the last 25 years, there has never been a rolling 120-month (ten-year) period when quality has not performed as well as or better than the MSCI World Index.

Focusing on quality stocks undeniably pays off if you are a long-term investor like me.

But how do we find the best companies?

When a business consistently earns high returns on its invested capital and operates with spectacular margins (as measured by the percentage of sales that ends up as real economic profit), these are telltale signs of an existing moat.

The term moat, popularized by Warren Buffett, refers to a business’ ability to maintain competitive advantages over its competitors in order to protect its long-term profits and market share. As Buffett stated in his 1995 letter to shareholders, “I look for economic castles protected by unbreachable moats.” Data shows that we should follow suit.

Why do I say that consistently high returns reveal the existence of a moat? The answer lies in how capitalism works…

Imagine that you see your neighbor set up a lemonade stand and hear him boast about earning sky-high returns on his investment with this simple business. Were you attracted by those returns, what could prevent you from copying him and taking some of his profits away? Absolutely nothing.

That said, while you can see Coca-Cola’s and Microsoft’s enviable returns, I wouldn’t bet on you beating the former with your newly launched soft drink brand or the latter with your “hot new operating system” or cloud service offer.

Your neighbor may earn high returns for a while, but as long as his business has no moat (competitive advantage) that could protect it, his margins will get competed away as new market entrants pounce on the opportunity. Capitalism is cruel, but it works.

The bottom line is that we seek companies with blatantly high returns and margins over long timeframes since these are the businesses with seemingly unbreachable moats that could defy the gravities of capitalism. We are screening for the following metrics on a global scale:

  • Return on Capital: The higher, the better since this is the after-tax rate of return on net business assets.
  • EVA Margin: Again, the higher, the better since this is the percentage of sales that ends up as EVA. This indicator consolidates pricing power, operational efficiency, and the quality of asset management into one overall score. This is the true effective business model productivity.

After examining these metrics on various timeframes, we compile a Quality Score (by converting the values to a percentile format and applying specific weightings to the parameters).

To give you a taste, here is how some members of our “top-quality universe” fare in the most important dimensions as compared to the S&P 500.

In summary, quality means that these companies:

  • earn high returns on the capital they employ, and
  • have a sustainable competitive advantage (that Warren Buffett calls “moat”), which prevents their competitors from taking away their extraordinary profitability.

It’s that simple. That said, quality alone doesn’t get us anywhere!

There are several high-quality companies that are essentially treading water, and their lack of growth opportunities hinders their potential to create value for their shareholders. (We call this group “legacy moats.”)

And this gets us to our second step…

Step#2: Growth is needed to drive performance

To qualify as a truly wonderful business, a top-quality company must also have growth opportunities that allow it to reinvest most of its cash flows at high rates of return.

That said, growth is tricky. How do you think most people measure it? They look at the firm’s top line (the sales figure) and earnings per share, which are important but can be misleading.

Positives first: Sales growth is the only sustainable source of great performance over decade-long timeframes since the potential effect of cost-cutting, and other efficiency-enhancing measures is always finite.

There is no “monster performance” without spectacular top-line growth, period.

But here comes Warren Buffett with a thought-provoking idea: “Growth is always a component in the calculation of value, constituting a variable whose importance can range from negligible to enormous and whose impact can be negative as well as positive.

How can growth be a negative? Let me explain…

Imagine a company that can reinvest its cash flows at a 5% rate of return and retains all its earnings to pursue such growth projects.

Sales and EPS could grow in this example… so would you be happy with this as an investor? The good answer always starts with “it depends”… (Basically, this is all formal education taught me.)

It depends on what return you could earn by putting that money in another investment opportunity with a similar risk profile. (That’s a relevant question since the retained earnings belong to the shareholders.)

As long as the company earns less on the retained cash than similar investments could return, growth doesn’t really serve you!

There are absolutely no-brainer cases, however, where it seems blatantly obvious that the company’s growth projects enrich shareholders.

Take a look at Microsoft’s data:

The steadily rising capital bars show that Microsoft keeps reinvesting in its business and is employing more and more capital.

This info alone is not enough to come up with a judgment, but taking a look at the sky-high return on capital numbers tells you the other part of the story: Microsoft can put every reinvested dollar to work in growth projects with returns of 30%+.

It’s hard to compete with such returns, so most investors should let great “reinvestment moats” like Microsoft do their magic. Here’s where Charlie Munger’s wisdom comes in handy: “The first rule of compounding: Never interrupt it unnecessarily.”

Now that you see that not all growth is equal, let me introduce another metric to complement the necessary but sometimes misleading sales growth.

Once you get the picture on how EVA (Economic Value Added) measures the true business performance (as detailed in this article) and how growing EVA by reinvesting cash flows at high rates of return is the driver of long-term shareholder returns (mathematically proven in this piece), you surely want to measure the growth rate of the companies’ real economic profit: EVA.

The institutional data provider I use has a metric called EVA Momentum, which simply measures the size-adjusted growth rate in real economic profit (scaled to sales or capital to avoid distortions). A higher number indicates higher performance.

Let’s summarize: To get a complex picture on the growth profile, we examine the following metrics on various timeframes.

  • Sales Growth: No monster performance is sustainable without top-line growth, so this is crucial.
  • EVA Momentum: Simply put, this is the size-adjusted growth rate in real economic profit (scaled to sales or capital to avoid distortions). The higher, the better.

As with the assessment of quality, we compile a Growth Score in a similar manner (by converting the values to a percentile format and applying specific weightings to the parameters).

To give you a taste, here is how some members of our “growth universe” fare as compared to the S&P 500.

Now that we have the Quality and Growth scores of all companies we want to rank and analyze, why not take a look at those names that offer the best of both worlds?

Step#3: Introducing the EVA Monsters

Quality without growth opportunities results in mediocre fundamental return potential. (This is why one has to buy the “legacy moat” type of businesses with a significant discount. Without the help of the valuation component, the total return would be unexciting with these “good quality, slow growth” names.)

On the other hand, growth is harmful without the existence of good quality. Reinvesting for the sake of empire building while earning subpar returns on the reinvested capital is a surefire way to value destruction.

So quality alone is not enough, while growth without quality is utterly dangerous. But the combination of quality and growth provides phenomenal performance.

Take a look at the data…

Falcon Method Vs market

We call those companies EVA Monsters that meet all our criteria on quality and profitable growth.

To summarize, EVA Monsters have three things in common:

  • They earn high returns on the capital they employ.
  • They have growth opportunities that allow them to reinvest most of their cash flows at high rates of return.
  • They have a sustainable competitive advantage (that Warren Buffett calls “moat”), which prevents their competitors from taking away their extraordinary profitability.

Since we are interested in the best quality-growth companies in the world, we combine our Quality and Value Scores into a Monster Score and rank all the stocks by this composite metric.

Seriously, after understanding how reinvestment at high rates drives long-term shareholder value creation, the performance chart above must not be that surprising.

You saw how much higher our EVA Monster universe ranks in terms of quality and growth compared to the market index, and you could see the mathematical proof that valuation only plays an important role in the short term, so there’s not much spectacle here.

Still, much more people call themselves long-term investors than those who really focus on quality-growth stocks. Numbers show that only the latter group follows the evidence-based way; all the others are swimming against the tide (or trying to fight the base rate, if you prefer the more scientific explanation).

Are you looking for real buy-and-hold investments? Then EVA Monsters should be your preferred category.

That said, there are only about 50 companies in the world that meet all our strict standards and are thus worthy of in-depth analysis.

With all other stocks, the underlying business is far from exceptional and thus provides less than stellar fundamental returns. Such stocks should only be purchased when the valuation is so depressed that a reasonably expected multiple expansion can propel the total return potential to appealing levels.

And they should be sold once the valuation part of the formula has played its part since you could only reap the mediocre fundamental returns of the underlying business from that point on. (More on these stocks at a later step of our process.)

Let’s keep focusing on our EVA Monsters for now and see what returns they could possibly offer.

Step#4: The windshield approach to rank the Monsters

You could argue that we have filtered and ranked thousands of companies so far solely based on backward-looking metrics that tell us little about the future.

Well, hard facts prove that the past is actually a good indicator of the future when it comes to the profitability of businesses:

In simple terms: good companies (and sectors) seldom become bad, and vice versa. So we have an evidence-based reason to apply the filtering and ranking algorithms based on backward-looking (institutional-level) data.

Nevertheless, I agree that it is time to move on and apply a forward-looking perspective on our shortlist of EVA Monsters.

What we do in step 4 is build EVA-based financial models for this select group of companies, one by one. For this, one needs to be aware of the components of Enterprise Value in the EVA framework.

Here’s a waterfall chart to illustrate what we are modeling.

We usually start with CVA (Current Value Added), which is simply the trailing four quarters’ EVA capitalized by the company’s cost of capital.

We do have the analysts’ forecasts on sales and EVA Margin, but we tend to modify these inputs if management’s guidance or our view on the fundamentals warrants a more conservative (and very rarely a more optimistic) stance.

Multiplying sales by the EVA Margin gives us the EVA figures for 5 years out. We also have the cost of capital numbers that we almost always correct upwards since the zero-rate environment will most likely not last forever. Once we’re done, we have our CVA component.

The capital part is easy since we have forecasts that we seldom modify. (That said, most EVA Monsters are not too capital intensive, so a minor change on this line would hardly alter our conclusion.)

The remaining part, FVA (Future Value Added), is a bit tricky. It basically measures how much of the company’s current market value stems from investors’ expectations on future EVA growth.

Confession time: we have absolutely no idea what Mr. Market will think at the end of our 5-year explicit period. So we do our best and take a look at how the market tends to value the business we are analyzing.

For this, we are using the FGR (Future Growth Reliance) metric, which is simply the ratio of FVA to Market Value. FGR essentially measures what percentage of the company’s market value stems from investors’ expectations on future EVA growth.

While FVA was an absolute dollar amount, FGR is a percentage that can act as a sentiment indicator.

To give you an example, here is how Alphabet’s (GOOGL) Future Growth Reliance fluctuated since 2006:

Based on the data (and our opinion whether the indicated FGR range could still make sense after 5 more years of growth), we model two scenarios: a conservative and an enterprising one.

In GOOGL’s case, let’s say that setting the FGR goalposts between 30% and 50% seems realistic at this point, so we can use these inputs to calculate the only remaining component of the Enterprise Value, the FVA. We model two scenarios, so we have two projected “exit Enterprise Value” levels.

If you take a look at the waterfall chart above, you see that the next we have to do is to get from the Enterprise Value to the Market Cap level (by adding the surplus cash, deducting debt and the present value of rents, and treating the “other” category as indicated by the chart).

Once we are done, all we have to do is add the dividends received (if any), and adjust for the effects of share repurchases or issuance based on the historical trend and management communication.

As a reward for fighting through all these details, let me show you what the result of our total return calculation would look like for GOOGL after applying the 30% and 50% FGRs.

You can see a range of outcomes, and the mid-point is marked. Based on these calculations, a 12-13% annualized return seemed like a reasonable expectation from Alphabet’s stock on a 5-year timeframe at the time of the analysis.

Building such models for all ~50 EVA Monsters (and keeping them up-to-date) is labor-intensive, but it can serve as the basis for ranking these exceptional companies by their current total return potential.

While we selected the members of this elite group with the help of backward-looking data, we are using forward-looking modeling to see which of them are the most promising investment candidates and are so worthy of our time.

Much more of our time, as you’ll see at the next step…

Step#5: Read, read, read… The qualitative aspects

Successful investors read a lot. There’s no exception.

Once we have those shiny Excel models, we have to dig deep to better understand the business.

Here are the main focus points of our analysis:

a) The sources and sustainability of the moat 

The lack of a durable moat (or the vulnerability of the moat) would make the long-term thesis unfounded since the company’s spectacular returns would get competed away.

What makes our job difficult is that management seldom communicates in a straightforward manner when it comes to their competitive advantages.

Look, it’s perfectly reasonable that no CEO will ever publicly boast about being at the helm of a monopoly and making obscene returns.

To illustrate this point, here is what renowned investor Mohnish Pabrai had to say about researching the Chinese internet giant, Tencent:

“I looked at everything the management team has ever said about their business since Tencent went public. And in 18-20 years, Pony Ma [the founder and CEO] has basically said nothing. They would report the facts but nothing about the great economics of the business.”

And this leads us to an important point: independent thinking must complement reading if you want to become a successful investor.

b) Capital allocation

Since reinvestment drives long-term returns, it is vital to understand how management uses the money produced by the business.

  • Are the actions consistent with the communication?
  • Are share repurchases carried out opportunistically to create value?
  • Do the return on newly invested capital and the reinvestment rate show any trend?

“The Outsiders” book by William Thorndike is a great read and can help you better understand the logic behind capital allocation decisions.

c) The drivers of growth

We have to answer questions like these: 

  • What trends support the company’s sales growth?
  • What’s the size of the total addressable market, and how saturated is it?
  • Is the company gaining or losing market share? (Or is it creating new markets?)
  • Are the margins trending upwards (e.g., as a result of scaling) or downwards (e.g., as a result of competitive pressures)?

We need to understand where the sales and EVA growth that analysts forecast can reasonably come from. We must identify the main growth drivers, which we will monitor closely.

For a simple business model like Starbucks, the main drivers are easy to list: same-store sales growth, store count growth, and margin expansion.

That said, once you dig deeper, you may realize that the company’s primary product is not coffee but the “Starbucks Experience,” so monitoring how the corporate culture, the HR side of the business develops is crucial.

d) Management’s integrity

We want a management team that openly discusses both the positives and negatives and whose actions are consistent with their words. Just a few points to consider:

  • Are they acting with the long-term interest of shareholders in mind? Or have they succumbed to Wall Street’s pressure to maximize (and possibly manipulate) short-term results?
  • How much of their net worth (or how many years of their salary) executives have invested in the company’s stock?
  • Are their insider transactions consistent with what they publicly say about the stock’s valuation?

The book “Dear Shareholders” by Lawrence A. Cunningham is a good read on the topic. (However, I don’t understand how IBM’s Ginni Rometty could feature among truly great CEOs after the outrageous value destruction she pulled off at IBM.)

What we read:

  • Annual Reports (even those of the competitors if available)
  • Strategic presentations and the related transcripts
  • Earnings call presentations and the related transcripts
  • Articles about the business and industry
  • Third-party analyses (as a last resort, only after we have processed all other information)

Listening to podcasts and watching video interviews may also complement the previous list in those cases where we need additional info to better understand the business or one of its products or services.

This step is undoubtedly not the sexiest part of the process, but it is absolutely essential. Let me show you why…

Step#6: Fine-tuning and Conviction

The deep-dive qualitative assessment of Step#5 usually takes more than 40 hours per company.

And we have a team of analysts, so you may even want to round this number up if you are planning to do it all alone.

(Remember: you can spare all this work and the cost of the expensive data we use, just by subscribing to The FALCON Method Newsletter.)

Devoting this much time results in a deeper understanding of the business, so it is time to revisit our EVA-based financial model and see if any modifications seem warranted.

Once you have a well-informed opinion on the competitive dynamics of the industry, you don’t have to blindly accept analysts’ estimates on margins and sales, just to name two lines.

After this fine-tuning is done, we get down to determine two entry price levels.

The first (and higher) one is the buy price that has the potential to give us a 15% annualized total return on a 5-year timeframe, IF we are not far off with our assessment on the firm’s fundamental performance AND the valuation remains within its typical historical range.

With this somewhat enterprising entry price, temporary valuation headwinds can make our journey somewhat stressful, but as long as the fundamental thesis remains intact, a decent total return should be in the cards. (And that 15% required return has some built-in margin of safety since nobody would shed a tear if the annualized return came in at ~12%.)

That said, we also set a lower, very conservative entry price, which we like to call our “5-star, or punchcard” price.

The punchcard name comes from Warren Buffett’s famous 20-slow rule, which essentially says that given a ticket with only 20 slots in it, so that you had 20 punches — representing all the investments that you got to make in a lifetime — you’d really have to think carefully about what you did, and you’d be forced to load up on the stocks you pick. Buffett says most people would do much better following this approach.

In short, the “5-star, punchcard” price is where even our most conservative analyst (that’s me, David) would take a full position in the stock. To get this price, we calculate with a very conservative exit multiple (the previously mentioned FGR, to be more exact), and the total return potential should hit 15% percent even in this scenario.

This means that in the rare cases when the firm’s fundamental business performance alone could give us a 15%+ return, the valuation component can be net neutral or even mild negative; otherwise, the entry price must be so low that some valuation tailwind could raise the annualized return to ~15%.

I firmly believe that this lower goalpost is so conservative that even if we are somewhat wrong on the qualitative side of our analysis, the margin of safety is significant from these “5-star” levels.

(This still doesn’t mean that the stock cannot go lower. We are no fortunetellers but business analysts.)

The higher the conviction we have about a particular company, the closer to the upper end of the range we start accumulating its shares, and the bigger the position size we aim for.

On the contrary, a lower conviction level would entail a smaller targeted position size with purchases started only closer to the lower end of the range, the “5-star, punchcard” price.

By the end of this step, we know what percentage of our portfolio we would be ready to allocate to the particular stock and what price levels we are waiting for to start buying.

This is a pretty well-structured, systematic approach if you compare it to how most people are “playing the stock market.”

When it comes to investing, we are dead serious.

Step#7: Who could beat the highest-ranking Monsters?

By this point, we know exactly which EVA Monsters (quality-growth stocks) provide the most attractive opportunities in the market.

(You get the TOP10 stocks every month, and our best picks with essentially no effort at all by subscribing to the FALCON Method Newsletter service here.)

But there is more…

Instead of sitting back and simply publishing this valuable list every month in the FALCON Method newsletter, we make additional efforts to discover another segment of the stock market that sometimes presents gems in the mud.

We call these companies “Fallen Angels.”

These are companies with immaculate dividend histories that

(1) provide reliable and growing passive income and

(2) exhibit a certain level of business stability that made it possible to put together a respectable dividend streak in the first place.

That said, very few of the dependable dividend payers are of the highest quality (as you can see the proof in this article), so we need to evaluate them in a very different framework from what you saw in the previous steps.

First and foremost, we want a spectacular total return potential, but not at all costs!

When it comes to risk, our number one priority is to avoid the value trap situations, so we disqualify every company which may be classified as value destructive or shrinking (based on their negative EVA Margin and EVA Momentum numbers).

As a reminder:

EVA Margin is the percentage of sales that ends up as EVA (real economic profit). This indicator measures business model productivity.

EVA Momentum is the size-adjusted growth rate in EVA (scaled to sales or capital to avoid distortions). The higher, the better.

Please note that this is a much lower quality threshold than what we applied to identify the select group of EVA Monsters.

Once we have the list of reliable dividend payers with positive EVA Margin and Momentum on various timeframes, we want to determine which of them are undervalued in historical terms.

To give you a hint on how historical undervaluation looks like, let me share H&R Block’s numbers:


As you see, all valuation metrics were lower than the averages on various timeframes when the data was retrieved.

At the FALCON Method, we always examine valuation from a multidimensional perspective, employing at least three different indicators.

Those stocks that pass this hurdle are ranked based on our composite Angel Score that measures the level of historical undervaluation and also gives some weight to business quality.

The higher the quality and more depressed the valuation, the better the investment opportunity, and the higher the stock ranks.

In this sub-segment, we expect the majority of our total return to come from the expansion of the valuation multiple while we are collecting the dividends, but we don’t anticipate too much growth in business fundamentals.

While the quality and growth factors played the most important part with EVA Monsters, it is the valuation that drives returns with these once-beloved dividend darlings that landed in the bargain bin. This describes perfectly why we call this category Fallen Angels.

Once we are done with Step#7, we have the list of the most attractive stocks to invest in, so our process has reached its ultimate goal.

There’s only one important question remaining…

+1 – When to sell?

As a FALCON Method Newsletter subscriber, you will get an email alert whenever a stock becomes a sell. Of course, we have an internal process built for that too…

For those who understand the role and importance of the various total return components with EVA Monsters and Fallen Angels, the simple rules on when to sell will not come as a surprise.

The number one insight in a nutshell

You saw that the expansion of the valuation multiple drives returns with Fallen Angel stocks. This expansion is a one-time event: the multiple will revert to its mean once and will not keep climbing further for decades.

Once the mean reversion happens, only the remaining components of the total return formula work for you. Simply put, you will reap the returns produced by the underlying company’s fundamental business performance (the combination of EVA growth, dividends, and share repurchases), and this return tends to be mediocre with most Fallen Angels.

Conclusion: selling Fallen Angel stocks once the valuation expansion happens is the reasonable decision.

With EVA Monsters, on the other hand, the growth part of the total return formula plays the central role. The implications of this difference are crucial. EVA growth is not a one-time event but can continue for decades if the company’s competitive position and growth opportunities allow it to reinvest a big part of its cash flows at high rates of return.

Conclusion: As long as the “Monster characteristics” of the business are intact, you have every reason to hold on to the EVA Monster stocks, (almost) regardless of valuation.

As you saw, with Fallen Angels, once the valuation multiple reverted to its mean or even overshot to the upside, there is not much one should wait for with selling.

You can call on the dividend yield theory or use valuation metrics like the NOPAT yield or Future Growth Reliance to get a picture on when to sell.

As for the FALCON Method, we send out sell alerts to our subscribers so they knew exactly when we thought Cummins (CMI) stock was ripe for selling, for example.

The Future Growth Reliance indicator underscored our buy and sell decisions…

… and Morningstar’s analysts also seemed to agree with us:

At the FALCON Method, we only look at third-party opinion to complement our independent analysis. That said, it is always good to see everything pointing in the same direction.

As for EVA Monsters, a “longer leash approach” is warranted since the majority of our returns stem from the growth component (the combination of the reinvestment rate and the return on that newly invested capital), and the longer the holding period, the less important the role of the valuation multiple becomes.

In summary: we keep our Fallen Angel positions on a relatively short leash and sell when they approach fair value, while EVA Monsters need that kind of extendable, longer leash since the valuation multiple is not the major part of our total return as long as the “Monster characteristics” remain intact.

When do we sell EVA Monsters?

  • When the business characteristics change and the Monster thesis seems broken.
  • When (1) the valuation got so high that the forward-looking total return potential sank to a mediocre level, AND (2) we managed to identify a better investment opportunity, which is absolutely not inferior in terms of quality and growth prospects.

You may want to reread the latter point a couple of times since all the criteria mentioned are vitally important.

My experience says that selling an EVA Monster almost always proves to be a mistake unless the business deteriorates meaningfully.

I know that for most people, it is hard to get over the psychological pressure to always do something just to feel worthy. Yet practicing inactivity pays off…

In Alice in Wonderland, one had to run fast to stand still. In the stock market, one who buys right must stand still to run fast.

We have a well-structured, evidence-based investment process to address cognitive biases and psychological issues. Let me round this piece off with one of my favorite quotes:

“If you can’t describe what you are doing as a process, you don’t know what you’re doing.” W. Edwards Deming

Have you fallen in love with the process? Here’s what to do…

Now that you are familiar with the FALCON Method stock selection process, basically, you have 3+1 choices:

  1. You can close this article, do nothing, and stick to your regular method for selecting stocks. If you decide to do this, we wish you the best!
  2. You can grab the opportunity to incorporate all this work, knowledge, and institutional data into your own selection process by subscribing to the FALCON Newsletter here.
  3. Or, if you want to dig deeper and learn more, you can take part in our Free Webinar, where we teach you even more about how EVA is calculated, and we give you a backstage view on how our FALCON Method process works in practice.
  4. (Essentially, nothing can stop you from selecting options 2 and 3 as well. This means you can get both the knowledge you crave and deserve and our TOP 10 stock picks every month with a click of a button.)

If you wish to learn more about the FALCON Method Newsletter service, click here!

If you want to learn more and get our FREE 90-minute webinar on stock investing, click this link!

Is That Stock Attractively Valued? Your Beloved Multiples May Fool You

The core principle of value investing is almost 100 years old, yet it is totally unchanged: always invest with a margin of safety.

This means that the stock you are buying must be priced at a huge discount to the underlying company’s intrinsic value. The part of the concept that is constantly changing is how you come up with the intrinsic value of the business.

Today most investors use the income statement and the balance sheet to calculate the value of the business. Common multiples are easily accessible on different websites that give the impression of thoughtful analysis and comparison of companies.

But the truth is that since the income statement and the balance sheet are both flawed from an investor’s perspective, these multiples are misleading and dangerous.

Serious stock investors should STOP using these multiples and focus on the business’s true profitability. (That is not presented in the accounting reports.)

In this article, we will go through the most common valuation multiples to bust them one by one. And at the end, we give you a link to learn more about valuing companies based on their true value creation. Long-term focused investors should focus on that instead.

Let’s start…

One of the first multiples: P/BV

Back in Ben Graham’s time (who is often referred to as the father of value investing), just after a depression, a company’s intrinsic value was defined as its liquidation value. Investors used the balance sheet to carry out conservative calculations to determine what shareholders would get if all the assets were sold and all liabilities were paid.

This is how they did it: Net Current Asset Value (NCAV) equals the company’s current assets minus its total liabilities (including preferred stock). Once you divide this NCAV by the number of shares outstanding, you’ll have a pretty good idea of what dollar amount a share may be worth if the business were to be liquidated.

Paying a much lower price than this was an approach that worked like a charm for over 40 years since stock prices were generally quite tightly tied to book values, and patient investors could often find companies that were out of favor, trading below estimated liquidation value.

As Bill Nygren, portfolio manager at The Oakmark Funds points out, “It was an asset-heavy economy, which made it appropriate to value businesses based on their tangible assets. In fact, as recently as 1975, 83% of the stock market value of the average company was represented by its tangible book value.”

Okay, now fast forward to today…

A lot has changed since then. Today you’ll see a much more asset-light economy, where intangible assets (like brand names and patents) account for over 80% of the average company’s market value.

(Just think about the industrial era when factories equipped with heavy machinery appeared on the balance sheet, compared to the intangible value of brands and software algorithms that is “invisible” to investors today.)

As Nygren puts it, “The linkage between book value and business value has been broken because so many important assets today are intangibles and don’t even show up on the balance sheet. […] For companies in the S&P 500 today, the correlation between stock price and tangible book value has become quite small, just 14%. This is a very big change from 25 years ago when that correlation was 71%—or 5x stronger than it is now.”

Here’s what Warren Buffett had to say about this shift: “My own thinking has changed drastically from 35 years ago when I was taught to favor tangible assets and to shun businesses whose value depended largely on economic goodwill.” Times are changing, don’t fall behind!

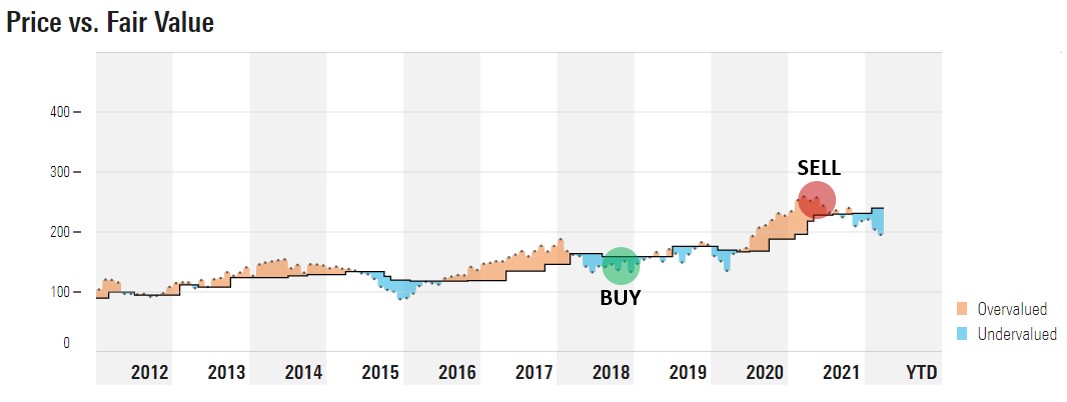
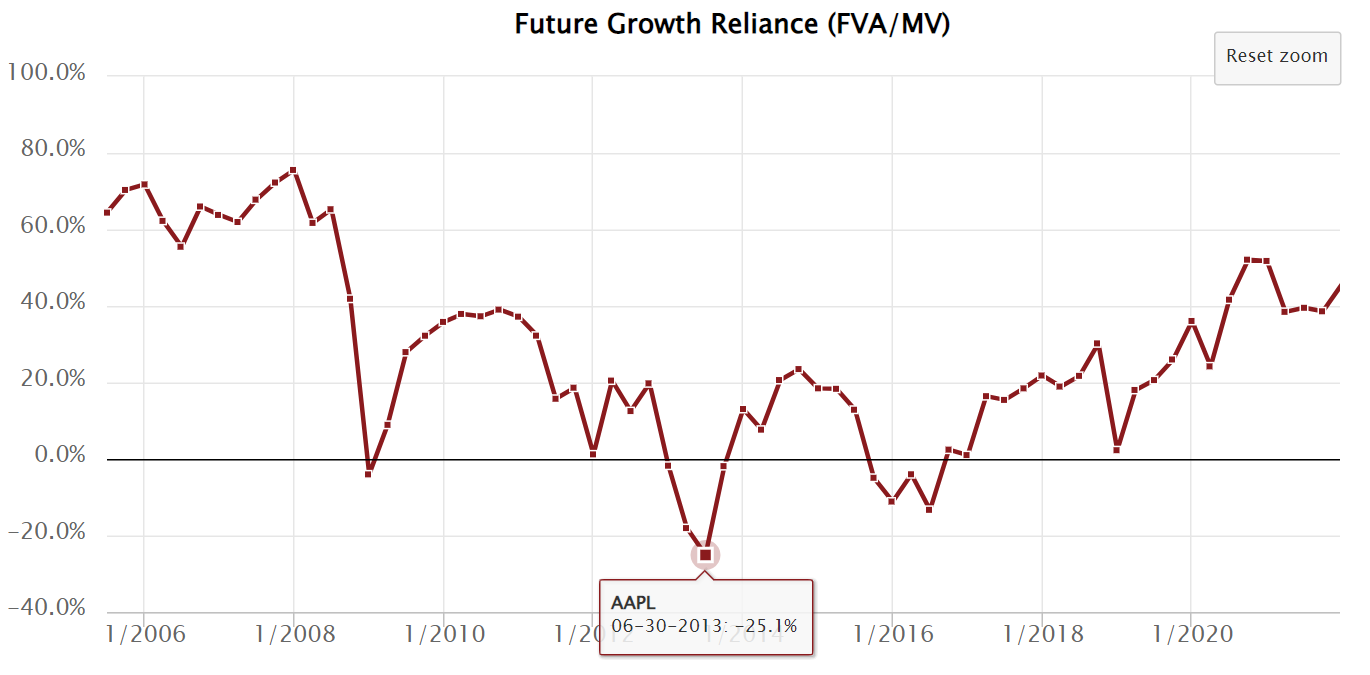
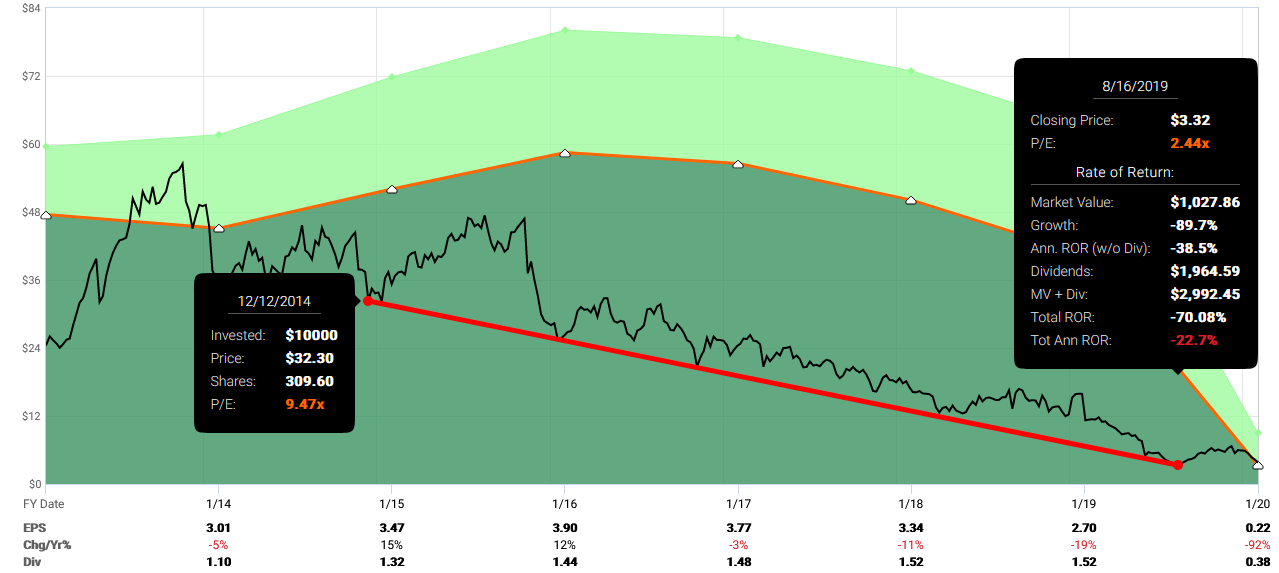
Here’s a sure bet: In hindsight, you must agree that buying Amazon’s stock at $600 around January 2016 would have been a great idea.

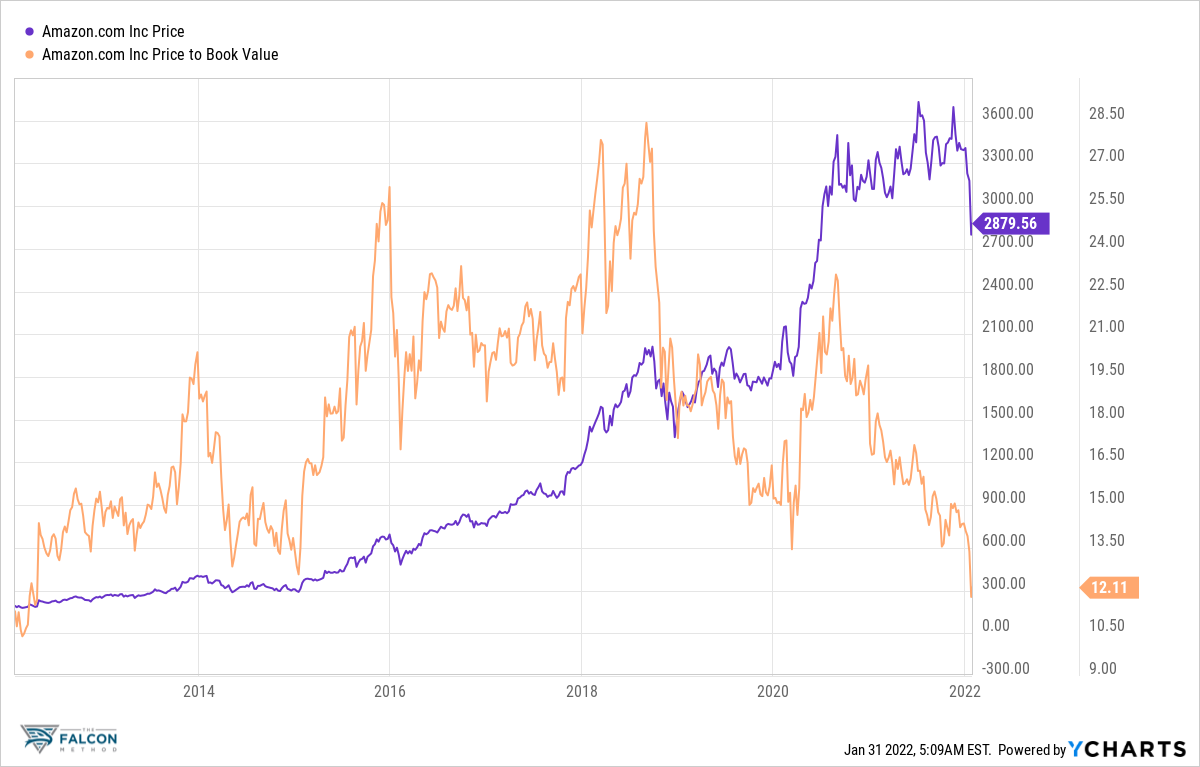
The thing is that the P/BV multiple of ~26 would have suggested otherwise.

That valuation metric was crying SELL at that time, while Amazon was creating shareholder value on a formidable scale. (I’ll show more on this later.) P/BV clearly doesn’t have much to offer in the modern economy, period.

Accounting is not for investors

It is no surprise that most investors have turned to the earnings power of the companies to determine their intrinsic value. Too bad the income statement fails them just like the balance sheet did!

The problem is that the income statement no longer provides a reliable indication of the value a company created in a particular year.

Accounting and reporting are not meant to help investors but for calculating taxes.

But calculating the proper earnings to pay tax is not what we are interested in since we would like to get a true picture of the company’s operations and future potential

GAAP (Generally Accepted Accounting Principles) fails miserably when it comes to treating different forms of investments.

For example, when a company builds a new factory to scale up its production and sales, money spent on the construction is not immediately reported on the income statement; instead, the new factory appears as an asset on the balance sheet, and the money spent is deducted over several years as a depreciation expense.

You might say: Standard practice, isn’t it?

Okay, but what happens if the company spends that same amount of money on R&D to come up with a new product, which could strengthen its competitive position for years to come?

GAAP accounting treats this R&D investment as an expense, which needs to appear on the income statement in full and thus pull down the current year’s earnings. If you think like a business owner, you must admit that spending on R&D and building a factory are both investments that will serve the company in the coming years or even decades, yet GAAP accounting creates distortion by treating them differently.

Or think about increased brand advertising as an example that would result in understated earnings. Under GAAP, intangible growth-producing activities are immediately expensed. For example, money spent on research and development or advertising, which pays off over time, is written off in the year incurred. Investors need to tackle such distortions.

To make matters worse, GAAP offers flexibility in deciding whether certain operating costs are capitalized or expensed. 

Capitalizing the costs means that those costs will not appear in the income statement and thus will not drag down the earnings of the current period.

Instead, they will show up on the asset side of the balance sheet under some fancy name and will be amortized over time.

AOL made the most of this when they capitalized their direct-response advertising costs (that were part of their normal operations) in order to overstate earnings. To add insult to injury, once that fictitious asset grew so big on the balance sheet that even its amortization expense was hurting the manipulated earnings too much, management decided to double the amortization period of these exploding marketing costs meaning that they essentially cut the annual drag on earnings in half.

This simple accounting adjustment helped hide AOL’s huge losses from investors. 

Whoever still makes investment decisions based on reported earnings numbers can easily fall victim to the “garbage in, garbage out” syndrome. You can be smart, but if your input data is of poor quality, your decisions will also be far from well-founded.

Let’s see what could go WRONG…

First, which multiple would you pick?

Is the most popular price-to-earnings (P/E) your multiple of choice with EPS in the denominator? 

If so, you must be rooting for an increase in the company’s earnings-per-share so that this higher EPS, multiplied by your target PE ratio (that you wish the stock would climb back to), would give a higher share price, thus a higher return on your investment.

The problem is that EPS is the earnings that accountants calculate, and accounting has serious flaws. Accounting essentially treats shareholders’ equity as a free form of capital with no required rate of return (unlike debt, on which the firm has to pay interest).

I have yet to meet a shareholder who wants no return on their investment; still, their equity contribution is treated as free money according to the Generally Accepted Accounting Principles.

In fact, EPS can increase if all earnings are retained and simply invested at a non-zero rate.

Let me show you an example of this:

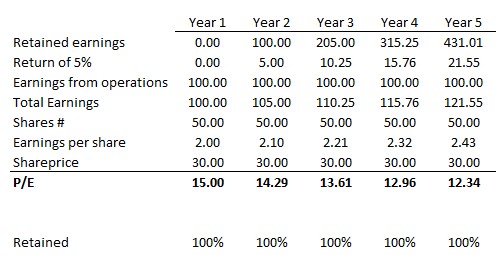
Assuming a company has earnings of $100 from operations in year 1 and retains all its earnings just to invest in a bond with a 5% annual interest rate, the company is doing better and better from an accounting standpoint. The earnings per share (EPS) increase, and the P/E decrease, signaling a better buying opportunity.

But does this make the company more valuable? Are you really satisfied with any non-zero return on that retained money that belongs to you?

From the investors’ perspective, it would be better just to pay out the earnings as dividends so that they could invest the money in other stocks, at least for the average stock market return of ~8%. Not doing so is a destruction of shareholders’ value!

To take this further, any investment financed with debt, such as a major acquisition, will contribute to accounting net income, increase earnings per share (EPS), and elevate the firm’s reported return on equity (ROE) so long as it generates a rate of return that is anything over the after-tax cost of the borrowed funds, that can be near zero these days.

Even Warren Buffett made this point in his 2017 letter to Berkshire shareholders: 

“The ample availability of extraordinarily cheap debt in 2017 further fueled purchase activity. After all, even a high-priced deal will usually boost per-share earnings if it is debt-financed. At Berkshire, in contrast, we evaluate acquisitions on an all-equity basis.”

Any firm can show positive net income and EPS along with EPS growth as long as it is covering the after-tax cost of the money it borrows. In accounting, stockholders’ equity is considered free.

As long as you have any return expectation when you invest in stocks, you must disagree with the Generally Accepted Accounting Principles (GAAP), and you most certainly need to address this issue when making investment decisions.

EPS says nothing about the true value creation of companies; thus, any multiple based on EPS should be used very carefully, if at all.

What about sales?

The biggest advantage of the commonly used P/S (price to sales) metric is its simplicity. Too bad the pros end here…

One of the downsides of the P/S ratio is that it doesn’t take into account whether the company makes any earnings or whether it will ever make earnings. Profitability makes all the difference! Consider a firm that loses money on every sale… Would you be happy with a high sales number, thus a seemingly cheap P/S multiple? Not really!

A dollar of sales at a highly profitable firm is worth more than a dollar of sales for a company with a narrower profit margin. Thus, the P/S ratio is generally useful only when comparing firms within an industry or industries with similar profitability levels, or when looking at a single firm over time.

In short: price to sales is not your reliable guide when assessing a stock’s valuation.

…but we still have cash flow!

“Earnings can lie, but cash flow cannot,” you may say. Unfortunately, I’ve seen too much to agree. While turning our attention to the cash-generating capability of the business is a great way to tackle most of the accounting distortions or outright manipulation, you have to accept that even the cash flow numbers can be fudged. Let me show you how!

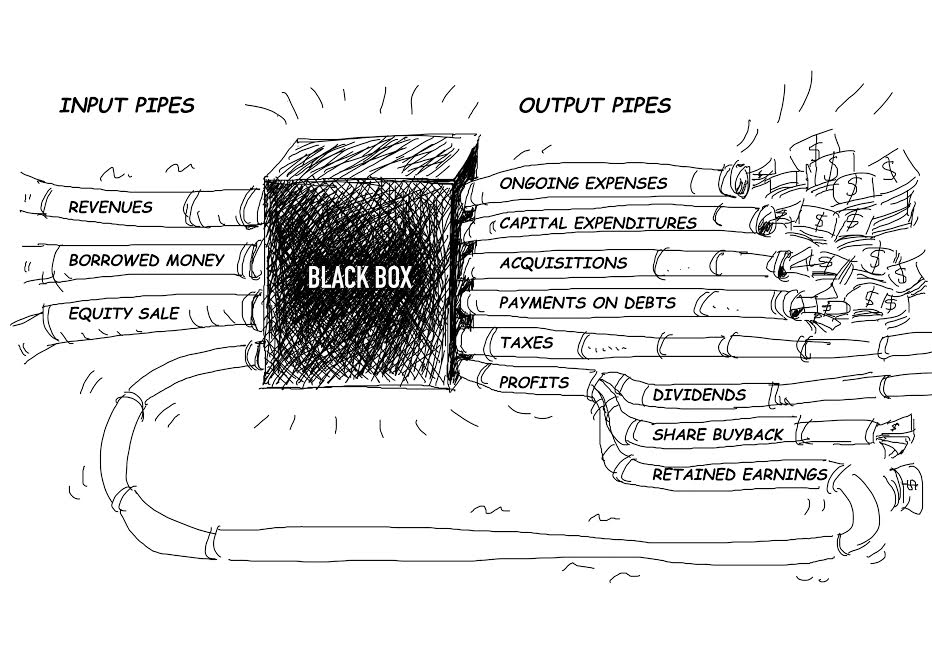
Managers know that sensible investors are trying to estimate the sustainable level of cash flow that the company can produce, as only this can be the basis of a sound valuation. The cash flow statement is made up of three parts: operating, investing, and financing sections.

Of these three, cash flow from operating activities is the only one that is deemed sustainable since, unlike the cash provided by investing or financing activities, operating cash flow comes from a renewable source, operations.

It’s no surprise that managers want to classify as much of the cash flow as operating as legally possible, even if that classification may not match the economic realities of the business.

Again, GAAP provides ample room for playing with certain items. (You can find dozens of tricks in the book Creative Cash Flow Reporting by Charles W. Mulford.)

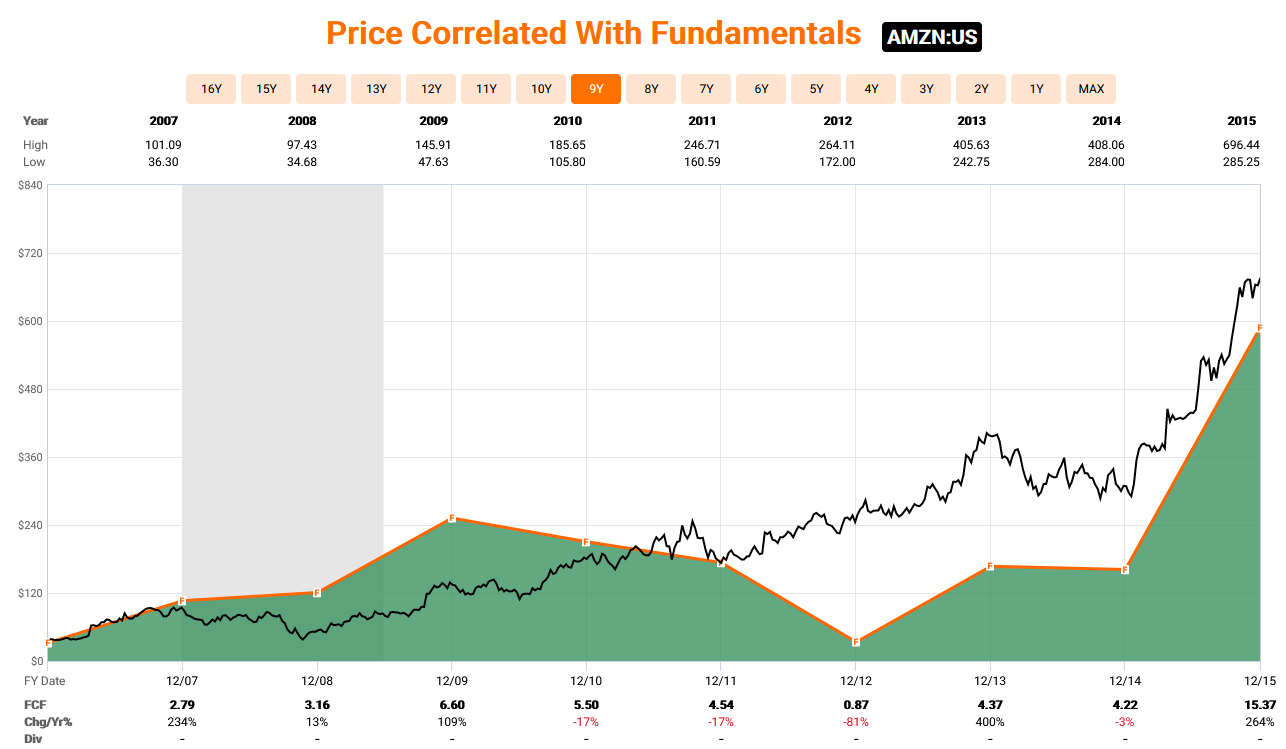
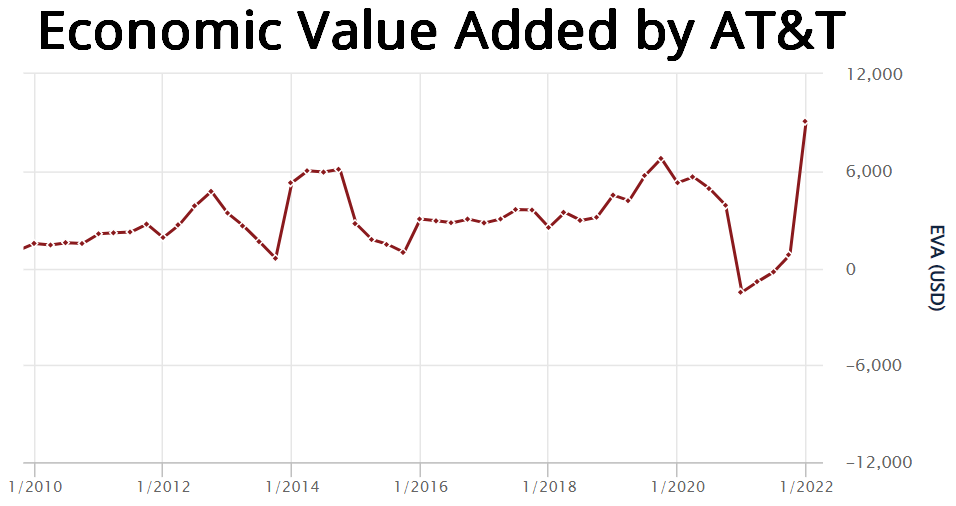
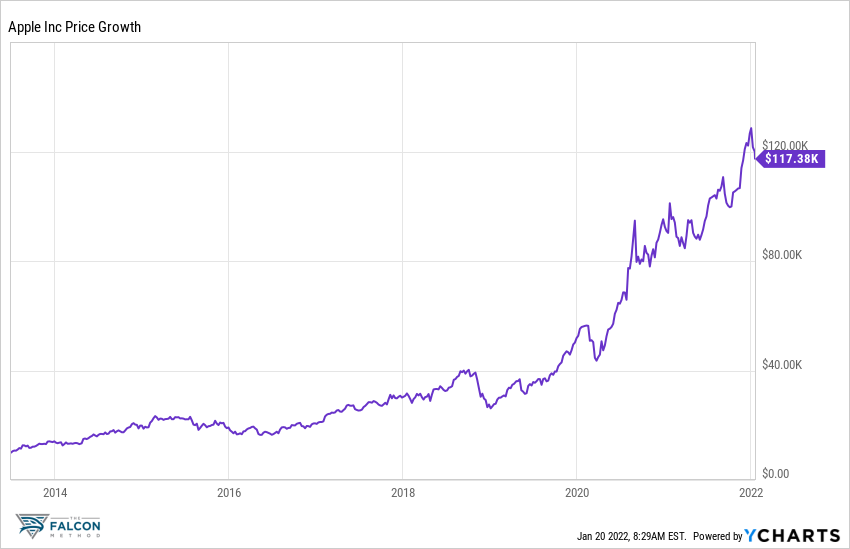
Looking at Amazon’s free cash flow (that is, operating cash flow minus capital expenditure) still doesn’t seem to explain the continuous upward momentum of the stock price. Looking at the green area showing free cash flow, all you see is bumpiness while the stock price was relentlessly moving up.

We need a much better explanation, a much closer relationship with the stock’s performance. Cash flow is just not good enough!

If cash is king… what about a free cash flow multiple?

Free Cash Flow (FCF) can be calculated by deducting capital expenditures from the operating cash flow. Basically, FCF is the amount of cash that remains after everything has been paid, all new investments have been made, and is available for distribution to the shareholders. The key question goes: Is more free cash flow always better? Not really!

A large amount of free cash flow may indicate that the company can’t find sufficient opportunities for new investments, which can limit future growth prospects. Negative free cash flow, on the other hand, could indicate that the company has an abundance of investment opportunities but not enough internal cash flow to pursue all of them.

In fact, FCF in any one year, or even over longer intervals, is not a reliable measure of performance. You saw this in Amazon’s example, right?

The key question is whether the company is investing in positive NPV (Net Present Value) projects that have attractive returns above the cost of capital. If yes, the more investments it makes, and the lower or more negative its free cash flow goes, the greater value is created (that will be reflected in the stock price).

It is simply not possible to tell whether a firm is more or less valuable by generating more or less free cash over a period of time, so there go the P/FCF and EV/FCF multiples out of the window.

That said, when I studied at Columbia Business School’s Value Investing and Advanced Value Investing courses, they advocated using EV/FCF and EV/EBIT as valuation multiples. Knowing what I know now, I’m not that fond of either. I’ll show you in a minute what my preferred metrics are and how I use them.

If you wish to devote some time to killing all the popular multiples containing EBIT, EBITDA, or book value, you may want to read the book Best-Practice EVA by Bennett Stewart. Not an easy read, but you can find examples there that illustrate how continuing growth in sales, EPS, EBIT, and EBITDA can be produced without any increase in shareholder wealth.

Even the PRICE is flawed

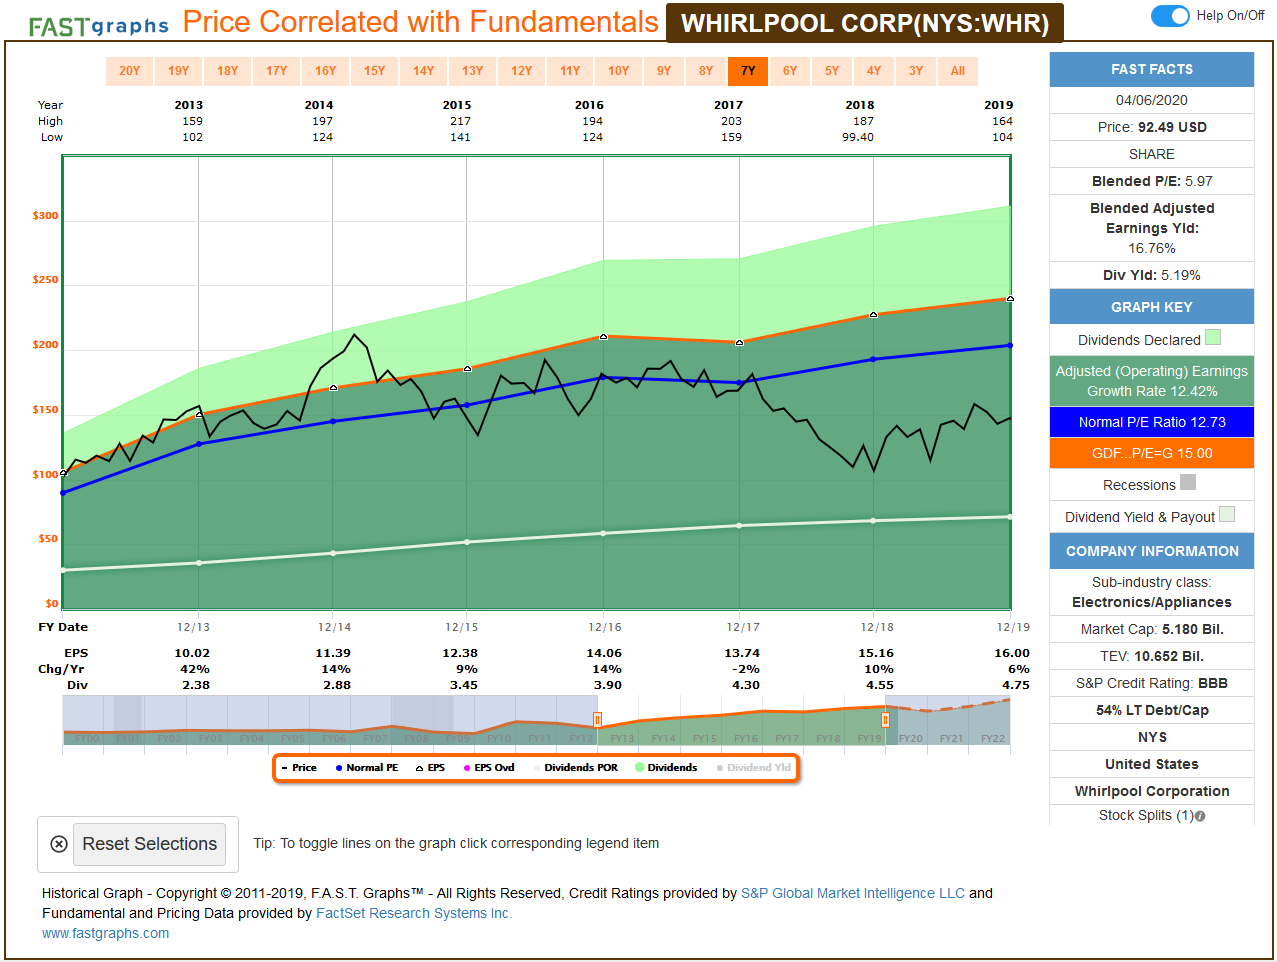
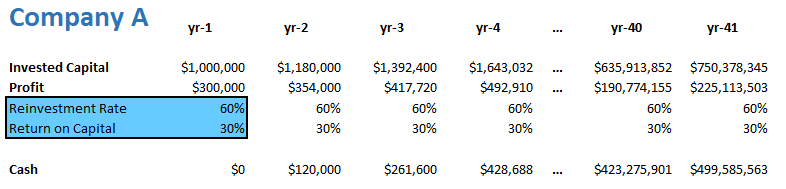
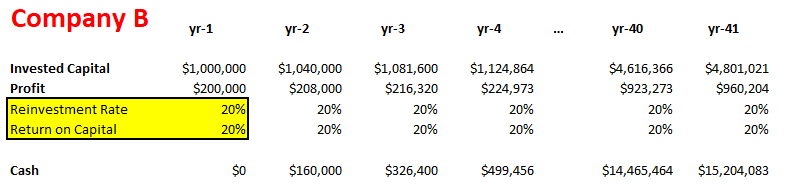
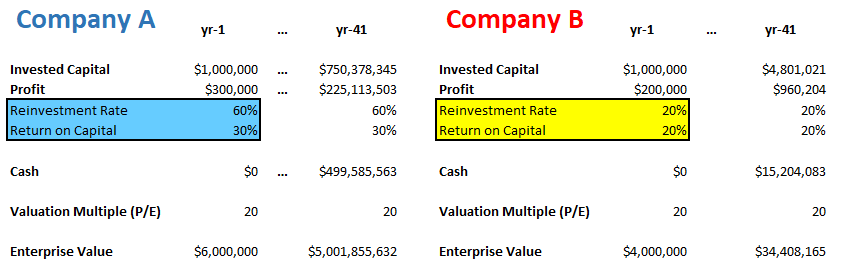
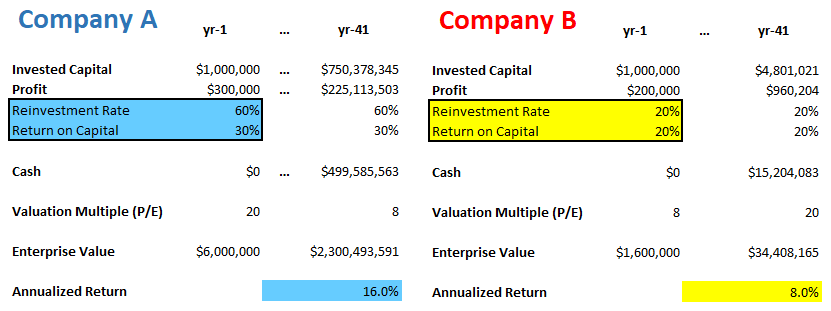
That said, the price (P) part of the ratio has its flaws as well. See Joel Greenblatt’s example below (from his book The Little Book That Still Beats the Market):

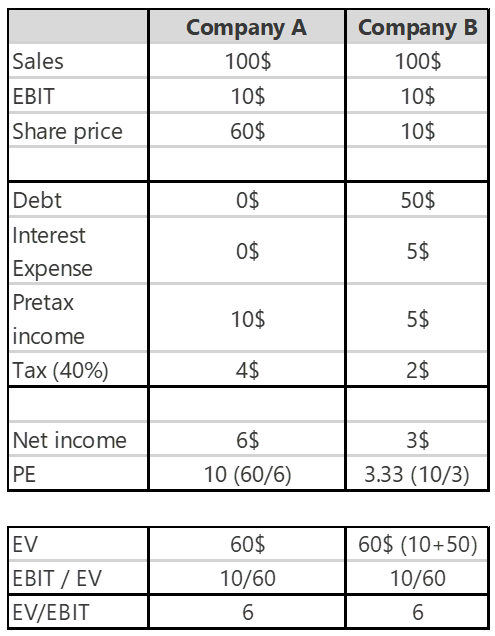
While A and B are the exact same companies, the difference in their capital structures distorts the PE (and all capitalization-based multiples, for that matter). Have you ever thought about this when mechanically applying your PE targets in a tool like FAST Graphs?

Sure, multiples using Enterprise Value (EV) instead of price address this problem, but as soon as you pick EBIT, EBITDA, or Free Cash Flow as the second part of your EV-based ratio, you may be in for some trouble.

As for EBITDA, Warren Buffett likes to say: “Does management think the tooth fairy pays for capital expenditures?” Excluding the necessary capital expenditures from any profit category (and valuation multiple) is a deadly mistake, and this is precisely what EBITDA does.

You may think EBIT could come to the rescue since it doesn’t exclude the depreciation and amortization part. True, but this earnings category is still derived from the profit & loss statement that is plagued by tons of accounting distortions.

With Free Cash Flow (FCF), as we mentioned earlier, our biggest issue is that greater FCF is not always better, as it can simply mean that the firm has no profitable reinvestment opportunities to pursue. Simply put, you cannot tell by a company’s FCF performance whether it is a good or bad business; consequently, you cannot use the FCF yield or EV/FCF metric to assess the valuation.

Warning: Not All Growth is Equal…

Many investors are fixated on growth (mostly EPS growth), and few take the time to contemplate that:

Not all growth creates shareholder value!

What I learned at Columbia Business School, the cradle of value investing (where Warren Buffett himself studied), was in perfect sync with what the EVA guys were saying.

Completing Columbia’s Value Investing and Advanced Value Investing courses taught me that the only type of growth that creates real value is where the incremental invested capital produces a higher return than the true cost of that capital.

EPS growth is easy to fabricate and is thus 100% meaningless! Remember the previous example of the company that invested in bonds at 5% interest and thus achieved earnings growth!

Or imagine a company that already has an extensive store network and great coverage in the country. Since management’s goal is to show growth, the retained earnings are not paid out as dividends but are used to open even more stores.

However, the returns for these new units are subpar (not as good as the previous ones), since the best locations are already taken.

Let’s say the company only achieves a 6% return on these new stores. Revenue and profit increase, and so growth is achieved. Well done?! 

However, the shareholders are worse off because the return on this newly invested money is less than what they could have earned by investing in the market themselves. This is a typical example of how focusing on earnings growth can lead management and investors astray.

The company created no real value, and shareholders shouldn’t be too happy with such a management team, but GAAP accounting provides reasons to celebrate for the ignorant investors. You should definitely break out of that category!

Do not follow the herd: Most valuation multiples are plain wrong!

Listen closely because this can be a game changer for you.

Everything you have just read comes down to a very important finding: the most widely-used valuation multiples can fool you (and other investors).

You’re not alone; most investors use multiples when it comes to assessing a stock’s valuation.

Your key takeaway is this:

The relevant metrics of business valuation may have evolved as decades went by, but as Berkshire Hathaway’s vice chairman Charlie Munger told at the company’s 2007 annual meeting:

“There is no one easy method that could be simply mechanically applied by, say, a computer and make anybody who could punch the buttons rich. By definition, [investing] is going to be a game which you play with multiple techniques and multiple models, and a lot of experience is very helpful.”

I couldn’t agree more.

Sensible stock investing is way too complex to qualify as a hobby or a part-time job. This is a profession!

At the FALCON Method, we are not “playing the stock market” but make thoughtful investment decisions supported by our evidence-based stock selection process. The difference between the two approaches is night and day!

Want to learn more?

This is how we value companies, based on their TRUE PROFIT metric, instead of the common multiples.

The FALCON Method newsletter service is there to support your investment decisions for a fraction of the fee we pay for the institutional-level data, so you get the work of our experienced analyst team as a bonus.

Ready to take the guesswork out of investing and get to the next level?

Learn more about how the FALCON Team uses these data to find the best stocks, or join our webinar on stock investing for free.

What is EVA and How to Find Attractive Stocks in Today’s Market?

To understand this piece of content, you must be familiar with the most important problems of the income statement and the balance sheet.

You have to accept the fact that accounting is not meant to help investors but to calculate taxes. Therefore accounting numbers are easily manipulated, and any multiple based on these reports is misleading and dangerous.

We have a whole article about proving these points; please, if you haven’t already, read it here:

Is That Stock Attractively Valued? Your Beloved Multiples May Fool You.

Just to recap things:

  1. Accounting treats shareholders’ equity as free money (distorts earnings)
  2. Accounting treats two identical investment decisions differently (distorts earnings)
  3. Accounting provides ample room for management to play with certain items (distorts cash flow)
  4. P/E, P/FCF, P/EBITDA, P/BV, ROI, and ROIC are also badly distorted, thus not suitable to base serious investment decisions on them
  5. Even the PRICE component in the commonly used multiples leads to distortions because of differences in capital structures (distorts all multiples using the P component)
  6. Earnings growth can be high and still lead to shareholder value destruction (Not all growth is good)

We have a lot of data from accounting that we can use, but NOT in the raw form accountants and quarterly reports show them.

As Warren Buffett wrote to Berkshire shareholders:

“Managers and investors alike must understand that accounting numbers are the beginning, not the end, of business valuation.”

The financial statements you can readily access should only be the starting point of your business analysis. Thoughtful investors have a lot of work to remedy these serious accounting distortions.

This is also crucial because today, with all the data at our fingertips, everyone is using the same multiples from the same websites, so it has become almost impossible to find an edge when valuing companies.

But those investors who can remedy these distortions and therefore come up with better fair value estimates are gaining an enormous advantage.

Let’s see how…

Where the TRUE profits are made

Since I put down my managing director position and sold my firm, I kept devouring books to explore every possible evidence-based way of wealth building and to get better and more confident investing my money.

After reading hundreds and hundreds of books on investing, in 2018, I came across a life-changing book while traveling to compete at IRONMAN Barcelona.

It was Best‑Practice EVA by Bennett Stewart and was so hard to read that I literally suffered through the 300 pages.

Still, it felt obvious that Stewart’s message about EVA (Economic Value Added), which is the true profit a business makes after several adjustments to its misleading financial statements, makes a ton of sense.

The main goal of EVA is to show you whether a company is creating value by earning more than its true cost of capital or not. (Surprisingly, about half of the publicly traded companies belong to the latter group.)

In the quest to discover this, addressing all the distortions of GAAP accounting one by one is inevitable. The EVA framework does just that.

EVA is the real value the company created in a particular year after addressing all accounting distortions. It’s not an accounting term, and you won’t find it on the income statement or the quarterly reports.

This is a TRUE PROFIT METRIC we have to calculate. To get to this true profit number, we do not have to start from scratch; that would be way too impractical and too much work. But we have to make the necessary corrective adjustments to arrive at the real economic profit of a business.

How to get to the EVA?

In simple terms, EVA is a metric that measures the firm’s profit remaining after:

  1. Deducting all costs adjusted for accounting distortions one by one
  2. Including the cost of giving the firm’s investors a full, fair, and competitive return on their investment in the business.

EVA is a comprehensive net profit score that charges for all capital used, including shareholders’ equity, which is falsely considered free money under GAAP accounting.

EVA is far superior to EPS or Free Cash Flow; in fact, charging for all capital makes EVA the most demanding profit performance measure and the number one choice for investors with a long-term business owner mentality.

Let me emphasize this again: EVA is very strict and sets the bar as high as possible.

Although Warren Buffett has never used the trademarked term EVA (Economic Value Added) in his letters, he keeps emphasizing the importance of the “money’s-not-free approach.”

EVA is sales less operating costs (adjusted for distortions) less the full cost of financing business assets as if the assets had been rented.

To be exact, there are at least 15 different accounting distortions that are corrected by the EVA framework. We already talked about the capital being free and the R&D investments.

But there are many more, like deferred taxes, managing leased assets, correcting impairment charges, operating reserves that need to be addressed, and many more nuances I do not want to cover here since it could fill a book alone.

In fact, there is a book about it called Best Practice EVA. But if you are curious about the details now, you can look at our list of the 15 most important accounting distortions here.

Case study: How good is EVA?

In the EVA framework, the company is earning a positive economic profit only after covering all resource costs, something that is true of only about half of the public companies in the economy at any time.

(Read it again: it is not at all evident that companies are earning adequate returns on the capital they employ. More companies are profitable in the accounting sense than those who can outearn their true cost of capital, with the equity portion included.)

Take a look at Whirlpool between 2013 and 2019!

As you see, earnings per share shows a nice increase almost every year between 2013 and 2019 (from $10 to $16), yet the stock price (the black line) is moving sideways. EVA shows you the reason:

Wherever EVA goes, the share price follows. (It’s proved by statistical methods, just keep on reading…)

We can create an “EVA Income Statement,” which is similar to the traditional income statement but meant to serve investors. These numbers are adjusted for accounting distortions and thus show the real economic profit investors should focus on instead of the traditional “earnings” meant for accountants.

Let’s take a look at Whirlpool’s numbers, and discuss why the stock price did not move:

While EPS exhibited growth, the increase in EVA (real value creation) was not that clear, to say the least. This is a classic example of where EVA and EPS differ, and EVA wins the argument.

That said, I came across a white paper which revealed the true relationship between the EVA-based shareholder return predictions and the actual shareholder returns. (TSR stands for Total Shareholder Return in the chart below.)

The Link Between TSR and EVA

Source:  The Link Between TSR and EVA, Bennett Stewart

The results are MIND BLOWING. The graph shows how close the predictions to the actual returns were. You can see that the predictions were almost 100% percent spot-on!

Once more: EVA is the TRUE economic profit that the company makes in a given year. This is what long-term investors should focus on, and this has the best predictive ability among all the different metrics.

That said, we have data to compare different performance metrics in their predictive ability of MVA.

MVA is a very significant measure, more important than Total Shareholder Return in many ways. MVA indicates how much wealth a company has created for its owners by comparing the cash that investors have put or left in the business with the present value of the cash they can expect to take out of it. MVA also measures a firm’s franchise value.

Without going into the details now, you can see from this graph that EVA momentum (which is just change in EVA divided by sales) is the best predictor of a business’s value creation.

How Does the EVA Framework Measure Valuation?

When it comes to valuation, I tend to prefer a complex approach instead of going with one single multiple or metric.

At the FALCON Method, we are using two distortion-free multiples (EV/EBITDAR and MV/NOPAT) and an EVA-based indicator (Future Growth Reliance) to assess a stock’s current valuation in historical comparison.

I am going to explain them one by one…

FGR: How much growth is priced in the shares?

As expectations about future value creation are a driver of the stock’s valuation, it’s time to dissect the components of value in the EVA framework so that we can see what expectations are reflected in the current stock prices.

Remember: EVA is the real value the business created for its investors. The more the EVA, the better the performance. In contrast to earnings or cash flow, EVA takes the distortions of GAAP accounting into account.

For quantifying the expectations for future growth in EVA, we can use the so-called Future Growth Reliance ratio. I deliberately simplify here just to get the point through as easily as possible.

Below you can see how these components make up the Market Value and how we can get from this enterprise-level metric to the market cap.

A firm’s market value consists of the following components:

  • Capital: That includes all capital invested in the business, including working capital, net property, plant, and equipment, the present value of rents, intangible capital, and several capital adjustments.
  • Current Value Added (CVA): The value derived from capitalizing current level EVA at the cost of capital in perpetuity. In practice, this is trailing 4-quarter EVA divided by the cost of capital (i.e., a zero-growth EVA perpetuity). This comes from assuming that the firm’s EVA remains constant forever.
  • Future Value Added (FVA): The present value of the expected growth or decline in EVA. When a stock has negative FVA, investors expect EVA to decline from its current level and vice versa.
  • MVA stands for Market Value Added and is the sum of CVA and FVA. MVA essentially measures how much more the company is worth than the capital that has been put in.

There is a way to derive FVA from share prices. This means we can calculate the ratio of the firm’s market value that is derived from and depends on future growth. (Measured in EVA, of course.)

This percentage value is called the Future Growth Reliance (FGR), which is just the ratio of FVA to market value.

In other words, Future Growth Reliance is the percentage of the market value that comes from future expectations and is yet to be realized.

So basically, FGR shows how much of the stock’s current market value stems from the expectations about future EVA growth.

For example, the FGR ratio of 20% says that the firm’s market value would tumble by 20% if investors became convinced that it would never be able to increase EVA above its current level.

A negative FGR ratio signals that the market is discounting the stock’s current level of EVA, indicating an expectation for future headwinds.

Let me put it this way: if the FGR equals -50%, but as an investor, you are convinced that the firm will be able to produce better results (higher EVA) than the current level, then you may have found an undervalued stock. (You shouldn’t pull the trigger just yet, but it’s a good sign.)

We mainly use the FGR for historical comparison, but this metric also comes in handy when setting the limits of the reasonable valuation range with our total return calculation.

To sum up, a higher FGR ratio indicates a higher valuation. We want to buy our top-quality stock targets when this sentiment indicator is low.

Here’s a short sample from the newsletter’s analysis on Tencent with the stock’s Future Growth Reliance presented below:

No matter how you look at it, the stock seemed to be attractively valued historically (at the time of publication) since the lower these metrics, the more pessimistic the valuation.

Two more valuation metrics

Since it’s always useful to inspect a company from more angles, besides Future Growth Reliance, we employ two other distortion-free multiples.

These are EV/EBITDAR and MV/NOPAT.

Numerators first…

EV and MV stand for enterprise value and market value, which are essentially the same, but the EVA guys are using two different labels for some reason.

EV or MV equals the value of the stock’s debt and equity capital, given its share price, net of excess cash, and assuming that the book value of liabilities approximates their market value.

Simply put, EV or MV equals: market cap + total debt – surplus cash.

We proved earlier that the “P” in multiples like P/E could be misleading when the company has any debt – which they usually do. By using EV or MV in our multiples instead of the PRICE, differences in capital structure will not distort our assessment.

So let’s see the denominators…

After corrective adjustments to remedy accounting distortions, NOPAT measures the free cash flow from operations that is distributable after ensuring that tangible and intangible assets needed to sustain the profit can be replenished.

EBITDAR is an improved version of the widely used EBITDA metric as it includes add-backs like rent expenses, R&D, and advertising spending.

Both the NOPAT and EBITDAR multiples are useful and highly-enhanced versions of the commonly used valuation multiples.

Two Eye-Opening Examples

The case of Zoom Video Communications (ZM) shows that it is easy to disappoint when essentially all the company’s value stems from future growth expectations.

On the other hand, Apple’s example shows that even wonderful companies can be bought at astonishingly attractive valuations.

The negative FGR means that the market was not only pricing in zero growth but even predicted value destruction. Investing $10K in Apple in June 2013 at the point of extreme pessimism would have netted you a ~12x result as of January 2022.

Using top-quality data pays off big time! Now let me show you something really interesting…

EVA for Everyone? Really?

I used to be a devoted dividend investor – I even wrote 2 books on the topic – but after discovering all the above, I started to pay more attention to the most important component of total return: EVA growth.

When compiling the FALCON Method newsletter’s list of Top 10 stocks, we are building EVA-based financial models to calculate a reasonable range for every stock’s annualized total return potential.

After reading the annual reports, earnings call transcripts, and watching management’s presentations; we feed our models with input data like analysts’ expectations on sales and margins, dividends, share buybacks, and historical valuation multiples.

We build both a conservative and an enterprising scenario to arrive at a range of results, as shown in the chart below.

Nobody knows the future, so thinking in ranges is the only sensible way to go. When you see numbers in the neighborhood of 20% while having a total return requirement of 12-15%, you know you have a significant cushion (a margin of safety) built in.

That said, we tend to be cautious when putting together the underlying models, so when the potential total return figures are this high after applying the margin of safety principle at every preceding step of the process, we know we are on to something promising.

We are looking for the best of the best quality companies (based on EVA metrics) with substantial projects to reinvest their earnings with high returns. This exceptionally good combination is rare but finding those pays off.

We call these companies EVA Monsters, and you can see their returns compared to some well-known indexes.

Falcon Method Vs market

Regardless of your investment style, I firmly believe that the EVA framework has something to offer you. 

For dividend investors, it may be worth taking notice that wherever EVA goes, the stock price follows; and it is also nice to earn great total returns while harvesting those reliable dividends.

See for yourself on the chart below.

Where EVA growth was lackluster, the share price went nowhere in the examined 5-year period, and dividend growth rates were also unimpressive.

On the other hand, dynamic EVA expansion entailed exceptional share price performance and dividend growth in the case of Domino’s and BlackRock. My preference is with EVA growers…

For hardcore value investors, EVA can help avoid value trap situations.

Investing in melting ice cubes that always look cheap all the way down to zero is the most costly mistake a value investor can make, and here comes EVA to the rescue, as shown in GameStop’s case study.

You can see that traditional, widely-used metrics like P/E showed that GME stock was cheap all the way down from $32 to $3.

Earnings per share was not there to guide your decision-making, while EVA acted as the canary in the coal mine and would have convinced you to steer clear of this value trap situation.

Last but not least, for growth investors, it comes in handy that EVA lets you separate the wheat from the chaff; thus, you can focus on the time-tested category of quality-growth stocks instead of buying all the speculative, cyclical “pure growth” names out there.

As the EVA concept highlights, only that type of growth creates shareholder value where the company earns a higher return on its growth projects than the true cost of the capital needed to finance those projects. All else classifies as value-destructive growth, and you’ll want to steer clear of those companies where management’s empire-building ambitions take priority over creating shareholder value.

I am ready to admit that after rereading the EVA book 5 or 6 times and diving deep into ISS’ institutional-level data, I wouldn’t make an investment decision without looking at the EVA metrics of the company I’m analyzing.

The only obstacle is that EVA data is probably too expensive for small investors.

Of course, there is a do-it-yourself way to calculate EVA, but as soon as you gain an in-depth understanding of all the accounting distortions and the accompanying remedies, you will most likely feel that it would take an unreasonable amount of your time.

I am grateful that the FALCON Method newsletter business made it possible for me to access the EVA database, evolve further, and take a giant step as an investor.

Thanks to this, anyone who subscribes to the Falcon Method Newsletter can profit from this data, which would otherwise be only available to those with exceptionally large capital.

With the help of the EVA data, I could repay my subscribers’ trust by taking the newsletter service to the next level, making 1000+ of them even more satisfied.

(We have a ~95% subscriber retention rate as I write this, which is considered exceptional in an industry with a standard rate between 70-80%.)

At the FALCON Method, we are using the EVA framework to identify the couple dozens of truly exceptional quality-growth companies worldwide (we call this category EVA Monsters, as shown on the chart above), and we are also continuously monitoring the market for reliable dividend payers with attractive total return potential (we call them Fallen Angels).

Our subscribers get the best of both worlds within the same service, so they can have their dividend income without compromising on total returns.

Makes sense? You can learn more about the FALCON Method here and see how you can make institutional-level decisions for a price that is affordable to individual investors.

Do you enjoy learning about investing? Then you will love our free webinar about EVA-based stock investing.

The 5 Steps of the FALCON Method

***UPDATE: As the FALCON Method kept evolving, this post got updated. You can read the latest version here.***

Identifying the quality stocks that are on sale can be easy if you have an evidence-based system to help you. The FALCON Method is an all-round investment process that relies on the principles of value investing, common sense, and quantitative discipline. The goal is to construct a buy and hold portfolio with a focus on both income and total return. All the steps are backed up by factual evidence as you’ll see below.

“If you can’t describe what you are doing as a process, you don’t know what you’re doing.” W. Edwards Deming

1: The Quality Criterion: Go for the true and tried!

Common sense idea: Only invest in top quality companies that have stood the test of time. These businesses have great internal economic fundamentals and long-term track records for performance and excellence.

 “Time is the friend of the wonderful company, the enemy of the mediocre.” Warren Buffett

As a long-term investor aiming for wealth building and reliable passive income, you should go for the wonderful companies instead of the mediocre ones.

Rule: Stocks must have at least a 20-year immaculate dividend history–meaning no dividend suspension or cut–to qualify. If a company has been able to pay growing dividends for decades, it’s a sure sign of its consistent earnings power. Taking this argument one step further, it is no surprise that companies with these characteristics tend to outperform.

“The importance of dividends in generating stock returns is not just historical happenstance. Dividends are the crucial link between corporate profits and stock values.” Jeremy Siegel

Evidence: The Dividend Aristocrats (stocks with 25+ years of rising dividends) have outperformed the S&P500 over the last 10 years by a considerable margin. (Source: us.spindices.com/indices/strategy/sp-500-dividend-aristocrats)

For further evidence read the book: The Future for Investors: Why the Tried and the True Triumph Over the Bold and the New by Jeremy J. Siegel

Here’s a short summary of the findings:

“We have also examined the 10 highest-yielding stocks among those that have not reduced their dividend in the last 15 years. A period of 15 years was chosen because that means the firm must have passed through at least one recession. Managements that have not cut their dividend have demonstrated the consistent earning power and strength of their corporations.” Prof. Siegel found that these group of stocks tends to outperform. This simple strategy had a 15.68% annual return between 1957 and 2003 vs. the 11.18% of the S&P 500.

We need a long dividend history so that we can test how the company’s management behaves when things get tough. Siegel uses a 15-year timeframe, while the FALCON Method goes for 20 years of immaculate dividend history. Notice also that the professor simply picked the highest yielding stocks from his select universe, while the FALCON Method uses a multi-faceted approach (the components of which are all proven).

2. The Value Criterion: Buy them on the cheap!

Common sense idea: Everyone loves bargain purchases. Buying top-quality stocks at low prices not only feels good but also leads to superior investment returns. Bargains are temporary as prices rise in the long-run (boosting our returns) to reflect the underlying quality of the businesses.

“Whether we’re talking about socks or stocks, I like buying quality merchandise when it is marked down.” Warren Buffett

Rule: Take a multi-dimensional look at valuation. Use indicators like Price-to-Adjusted Operating Earnings, Price-to-Operating Cash Flow, Price-to-Free Cash Flow, Price-to-EBITDA and examine their historical averages in multiple time frames. Compare the current valuation ratios to the historical averages and make sure that the current level reflects a fair or better price. If you buy top quality stocks at below-average valuation the powerful force of mean reversion is on your side. (Valuation ratios tend to move back toward the mean or average and this multiple expansion helps your investment returns.)

Evidence: Look at the performance stats of the S&P 500 Pure Value Index and the MSCI World Value Index and see that value investing outperforms in the long run.

We also have historical proof showing the outperformance of the individual factors used. When examining the tables below, please notice that the longer the holding period the higher the probability of outperformance is with all the factors.

Price-to-Earnings type of indicators:

An example, and your key to understanding these tables: If you pick 10-year holding periods from 1964 to 2009, the most attractively valued tenth of stocks (the Earnings/Price Decile 1) outperformed the market 99% of the time. The average annual excess return was 4.63%. All the tables below should be read in the same way.

Price-to-Cash Flow type of indicators:

There was not a single 10-year period in the sample when the most undervalued tenth of stocks (based on cash flow to price) did not outperform the market.

And the same is true for the EBITDA metric below.

Using these proven indicators to gauge valuation levels and going for the historically undervalued quality stocks tilts the odds of success in our favor.

3. The Threshold Criteria: Are you getting paid enough?

Common sense idea: For every dollar you invest you want to get the most possible money in return. Under a certain threshold, you are not that keen to invest your capital at all.

Rule: Compare the price you pay for a stock to the amount of Free Cash Flow the company produces per share (FCF yield), the money it returns to its shareholders through dividends and buybacks (shareholder yield), and the dividend it pays (dividend yield). Taking the prevailing market conditions into account, set absolute minimum requirements for these three and only consider a stock worthy of your money if it meets all these three criteria.

Evidence: The selection of the three indicators is logical since you demand that the company produces surplus cash, returns some of it to the shareholders, and makes dividends a considerable part of these returns. Besides being logical this selection is also evidence-based. See below, how all of these factors support outperformance.

Price-to-Cash Flows, again:

The shareholder yield as a strong factor:

For additional evidence on this metric read the book Your Complete Guide to Factor-Based Investing by Andrew L. Berkin and Larry E. Swedroe. The authors elaborate on how investing in the stocks providing the best shareholder yield has outperformed both the market and the simple dividend-yield strategy in three out of the past four decades.

The dividend yield also deserves a place in our system but it wouldn’t be enough on its own!

James P. O’Shaughnessy finds in his book What Works On Wall Street that the dividend yield becomes much more powerful as a factor if used with a select group of quality dividend paying stocks only (instead of all the stocks on the market). Exactly how the FALCON Method does it.

4. Yield Plus Growth: A multifactor ranking for maximizing total return

Common sense idea: All things being equal, the higher dividend and the higher dividend growth you get for your money, the better. Your total return is determined by three components: the starting dividend yield, the growth of the underlying company, and changes in the valuation multiple. (The latter has been taken care of in the second step of our process.)

Rule: Rank the stocks that survived the previous steps based on yield-plus-growth characteristics. Instead of using an oversimplified indicator like the popular Chowder number employ a weighted multifactor quantitative ranking with yield-plus-growth numbers of different time frames. The higher the yield-plus-growth rank, the better.

Evidence: Stocks of companies that keep growing their dividends tend to outperform. (Source: Oppenheimer)

Additional evidence about the relevance of dividend yield and growth:

Why Dividends Matter (Guinness Atkinson Funds)

Reasons to Consider Dividend-Paying Stocks (Dreyfus)

Dividends for the long term (J.P. Morgan Asset Management)

5. Sleep Well At Night: The finishing touches

Common sense idea: No matter how good a stock looks in a ranking system if you don’t feel comfortable investing in it you will have a hard time holding on when panic erupts. Only buy stocks that you intend to hold for the long-run.

At this point, rules have already played their part and human judgment comes into play. No matter how much one prefers quantitative methods some things simply cannot be quantified, filtered, and ranked in an automated way.

A few examples: Cyclical and non-cyclical stocks should be evaluated differently, while certain sectors have their specific metrics (like REITs). I would never sleep well without having a thorough look at how well the company employs its capital (I am looking for consistently high return-on-invested-capital) but I wouldn’t rank and eliminate firms based on this metric alone. Last but not least, I am also calculating what total return I can expect from the investment based on very conservative assumptions about growth and valuation multiples. This is a time-consuming and knowledge-intensive step that is only carried out with the stocks that seem to deserve it.

As a result: The FALCON Method gives the list of Top 10 stocks that best fit the “quality merchandise on sale” description in any market environment. I also like to highlight my Top Picks from this list every month that may not be the stocks that are ranked highest since not all the qualitative factors are represented in the scoring system.

+1: When to Sell?

This is a buy and hold approach so selling occurs rarely; only when a stock becomes extremely overvalued, or if it reduces its dividend. A dividend cut means that the investment theme is broken and action must be taken since dividend cutters tend to underperform.

“When the facts change, I change my mind. What do you do, sir?” John Maynard Keynes

Source: Dividends for the long term (J.P. Morgan Asset Management)

While a dividend cut is a clear sign, extreme overvaluation cannot be identified by a single metric like a P/E above 40. I always look at the historical ranges of the dividend yields and various valuation metrics and I only push the SELL button (and send out an alert about this decision) if most of the indicators point towards that direction. Stocks that became overvalued have subpar total return potential as the data shows so there is no reason to hold them.

Source: The Case for Value by Brandes Investment Partners

How to use this info?

You can get the ready-to-use stock picks of the FALCON Method straight to your inbox every month if you give the Newsletter a try. Currently, there is a 7-day free trial, so you are truly not billed for 7 days. Have a look at the newsletter and if you don’t like it, just email me at david@thefalconmethod.com within the first 7 days and you can opt out without paying anything. If I were you, I would use the discount code that is included in this free guide to get the best deal.

The newsletter comes with an easy-to-use one-page summary and it also includes the detailed analysis of the Top 10 stocks. You have everything there to start building your portfolio.

If you have questions, email me and I will reply to you personally, in most cases within 24 hours.

Want to learn more about the FALCON Method before giving the newsletter a try? Check out the book!

Get my FREE Guide on Investing!

Discover how to build passive income and wealth with the confidence that evidence-based investing can give you.

Where Can I Send
Your Guide?
Enter your name and email address below to get instant access.
Send Me The Guide
You will only get top-notch content from me.
close-link
Where Can I Send
Your Free Course?
Enter your name and email address below to get instant access.
Send Me The Course!
You will only get top-notch content from me.
close-link
You Can Watch The Replay Instantly...
Enter your name and email address below to get instant access.
You will only get top-notch content from us.
close-link
Upgrade your stock investing process...
Enter your name and email address below to get instant access.
You will only get top-notch content from us.
close-link