It was one of the most exciting days since I started investing…
My palms were sweating; I felt like my heart would jump out of my chest…
I was heading to the Florida office of Chuck Carnevale, the co-founder of FAST Graphs (the “Fundamentals Analyzer Software Tool” I mainly use for illustration purposes).
By then, Chuck had half a century of investment and wealth management experience, so I was very excited to pick his brain.
We sat down, and he casually launched the FAST Graphs website, entered a stock ticker, and showed me some fundamental data on a chart. Then he popped the question:
“Would you invest in this company?”
I blurted out an instant, “No way!”
Then I went on to elaborate on the pitfalls of analyzing cyclical stocks like the one he picked to test me.
I’ll never forget Chuck’s face lighting up when he said, “Now we’re talking!”
He became enthusiastic because he realized we would spend the rest of the hour talking seriously about investing in good businesses instead of speculating on stocks.
I tell you this story because my process will be of great value to those who are not “playing the stock market” but want to own stocks as business owners…
If you consider yourself a long-term stock investor, then this process can be very valuable for you.
To fully understand the steps below, first, you need to have a deep understanding of these basics:
- Accounting numbers are not meant for investors, and commonly used multiples are dangerous to use. (Read my article about it here!)
- You need better quality data measuring the real economic profit of the business. This is EVA, the most demanding profit score that remedies accounting distortions and calculates with the true cost of capital. (Read about it here!)
- You have to understand the difference between “Fallen Angel” and “EVA Monster” stocks because these two categories must be analyzed in different frameworks. (Read about it here!)
I have become a successful investor through a lot of learning, and I made tons of mistakes you don’t have to.
My investment results started to become consistently good after I could clearly describe what I was doing as a structured process.
This is not as hard as it may seem, so let me show you the exact 7-step process I am using today with my own money to pick (and sell) stocks.
It took me years to perfect these steps, and I am sure you will be greatly rewarded if you can follow them.
(And just to make it clear: this whole process is included in The FALCON Method Newsletter service, so this is the work you can skip just by subscribing here.)
Let’s see the steps of The Falcon Method…
Step#1: Screen for Top-Quality
A picture is worth a thousand words, and I’m an evidence-driven guy, so I invite you to take a look at the following chart first.
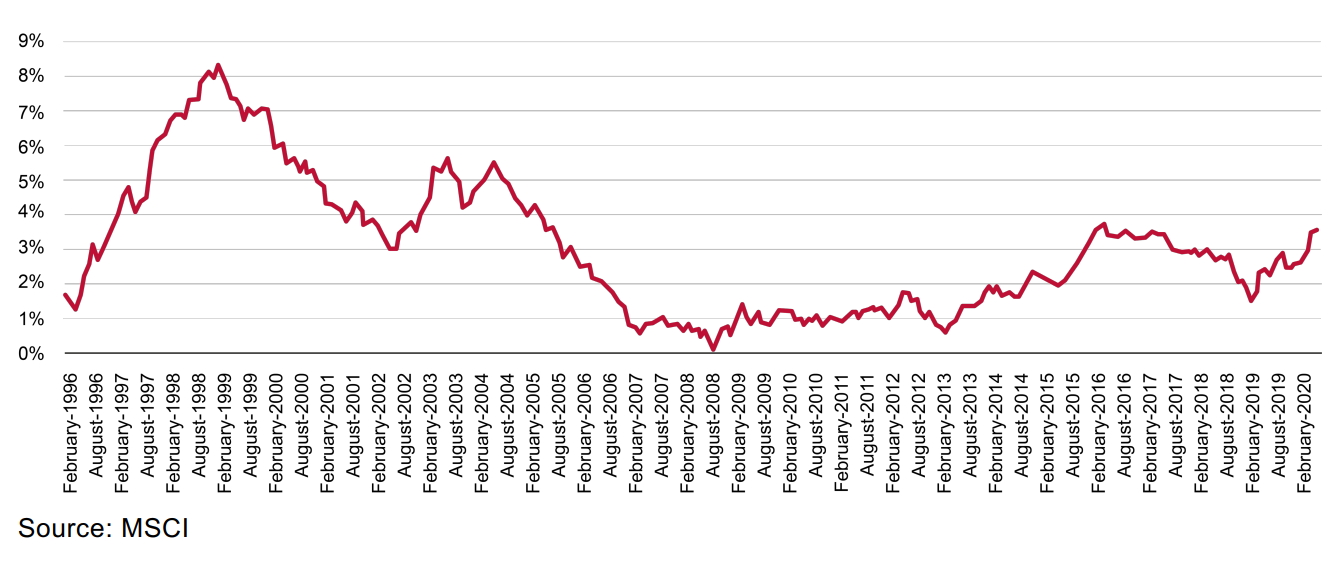
You can see the excess returns of the MSCI World Quality Index, which is the amount by which this Quality Index beats the core MSCI World Index.
Let me translate: Over the last 25 years, there has never been a rolling 120-month (ten-year) period when quality has not performed as well as or better than the MSCI World Index.
Focusing on quality stocks undeniably pays off if you are a long-term investor like me.
But how do we find the best companies?
When a business consistently earns high returns on its invested capital and operates with spectacular margins (as measured by the percentage of sales that ends up as real economic profit), these are telltale signs of an existing moat.
Why do I say that consistently high returns reveal the existence of a moat? The answer lies in how capitalism works…
Imagine that you see your neighbor set up a lemonade stand and hear him boast about earning sky-high returns on his investment with this simple business. Were you attracted by those returns, what could prevent you from copying him and taking some of his profits away? Absolutely nothing.
That said, while you can see Coca-Cola’s and Microsoft’s enviable returns, I wouldn’t bet on you beating the former with your newly launched soft drink brand or the latter with your “hot new operating system” or cloud service offer.
Your neighbor may earn high returns for a while, but as long as his business has no moat (competitive advantage) that could protect it, his margins will get competed away as new market entrants pounce on the opportunity. Capitalism is cruel, but it works.
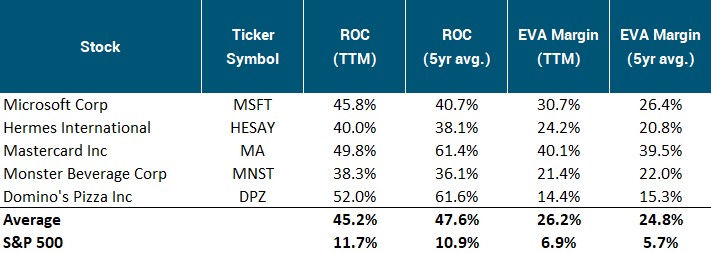
The bottom line is that we seek companies with blatantly high returns and margins over long timeframes since these are the businesses with seemingly unbreachable moats that could defy the gravities of capitalism. We are screening for the following metrics on a global scale:
- Return on Capital: The higher, the better since this is the after-tax rate of return on net business assets.
- EVA Margin: Again, the higher, the better since this is the percentage of sales that ends up as EVA. This indicator consolidates pricing power, operational efficiency, and the quality of asset management into one overall score. This is the true effective business model productivity.
After examining these metrics on various timeframes, we compile a Quality Score (by converting the values to a percentile format and applying specific weightings to the parameters).
To give you a taste, here is how some members of our “top-quality universe” fare in the most important dimensions as compared to the S&P 500.
In summary, quality means that these companies:
- earn high returns on the capital they employ, and
- have a sustainable competitive advantage (that Warren Buffett calls “moat”), which prevents their competitors from taking away their extraordinary profitability.
It’s that simple. That said, quality alone doesn’t get us anywhere!
There are several high-quality companies that are essentially treading water, and their lack of growth opportunities hinders their potential to create value for their shareholders. (We call this group “legacy moats.”)
And this gets us to our second step…
Step#2: Growth is needed to drive performance
To qualify as a truly wonderful business, a top-quality company must also have growth opportunities that allow it to reinvest most of its cash flows at high rates of return.
That said, growth is tricky. How do you think most people measure it? They look at the firm’s top line (the sales figure) and earnings per share, which are important but can be misleading.
Positives first: Sales growth is the only sustainable source of great performance over decade-long timeframes since the potential effect of cost-cutting, and other efficiency-enhancing measures is always finite.
There is no “monster performance” without spectacular top-line growth, period.
But here comes Warren Buffett with a thought-provoking idea: “Growth is always a component in the calculation of value, constituting a variable whose importance can range from negligible to enormous and whose impact can be negative as well as positive.”
How can growth be a negative? Let me explain…
Imagine a company that can reinvest its cash flows at a 5% rate of return and retains all its earnings to pursue such growth projects.
Sales and EPS could grow in this example… so would you be happy with this as an investor? The good answer always starts with “it depends”… (Basically, this is all formal education taught me.)
It depends on what return you could earn by putting that money in another investment opportunity with a similar risk profile. (That’s a relevant question since the retained earnings belong to the shareholders.)
As long as the company earns less on the retained cash than similar investments could return, growth doesn’t really serve you!
There are absolutely no-brainer cases, however, where it seems blatantly obvious that the company’s growth projects enrich shareholders.
Take a look at Microsoft’s data:
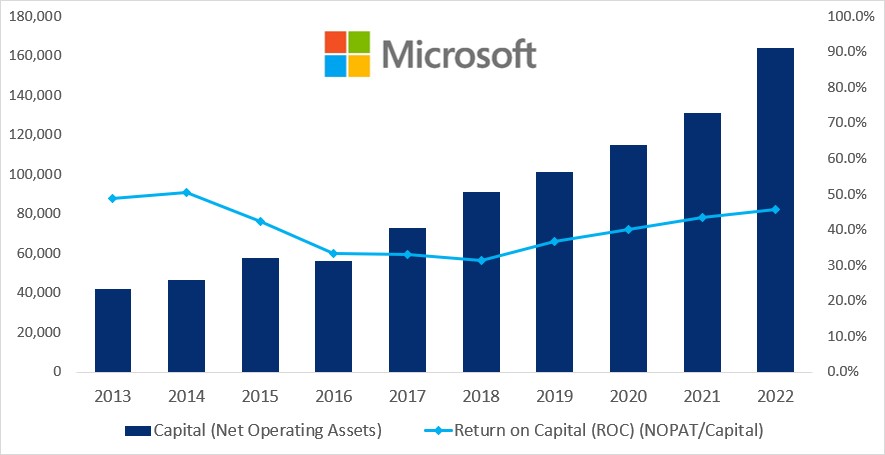
The steadily rising capital bars show that Microsoft keeps reinvesting in its business and is employing more and more capital.
This info alone is not enough to come up with a judgment, but taking a look at the sky-high return on capital numbers tells you the other part of the story: Microsoft can put every reinvested dollar to work in growth projects with returns of 30%+.
It’s hard to compete with such returns, so most investors should let great “reinvestment moats” like Microsoft do their magic. Here’s where Charlie Munger’s wisdom comes in handy: “The first rule of compounding: Never interrupt it unnecessarily.”
Now that you see that not all growth is equal, let me introduce another metric to complement the necessary but sometimes misleading sales growth.
Once you get the picture on how EVA (Economic Value Added) measures the true business performance (as detailed in this article) and how growing EVA by reinvesting cash flows at high rates of return is the driver of long-term shareholder returns (mathematically proven in this piece), you surely want to measure the growth rate of the companies’ real economic profit: EVA.
The institutional data provider I use has a metric called EVA Momentum, which simply measures the size-adjusted growth rate in real economic profit (scaled to sales or capital to avoid distortions). A higher number indicates higher performance.
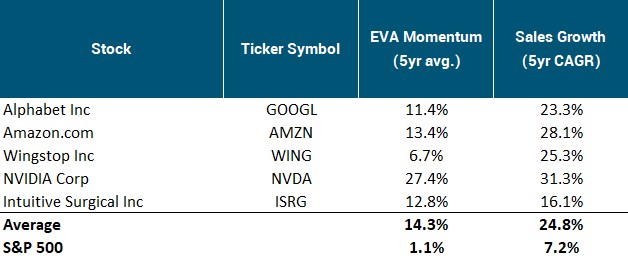
Let’s summarize: To get a complex picture on the growth profile, we examine the following metrics on various timeframes.
- Sales Growth: No monster performance is sustainable without top-line growth, so this is crucial.
- EVA Momentum: Simply put, this is the size-adjusted growth rate in real economic profit (scaled to sales or capital to avoid distortions). The higher, the better.
As with the assessment of quality, we compile a Growth Score in a similar manner (by converting the values to a percentile format and applying specific weightings to the parameters).
To give you a taste, here is how some members of our “growth universe” fare as compared to the S&P 500.
Now that we have the Quality and Growth scores of all companies we want to rank and analyze, why not take a look at those names that offer the best of both worlds?
Step#3: Introducing the EVA Monsters
Quality without growth opportunities results in mediocre fundamental return potential. (This is why one has to buy the “legacy moat” type of businesses with a significant discount. Without the help of the valuation component, the total return would be unexciting with these “good quality, slow growth” names.)
On the other hand, growth is harmful without the existence of good quality. Reinvesting for the sake of empire building while earning subpar returns on the reinvested capital is a surefire way to value destruction.
So quality alone is not enough, while growth without quality is utterly dangerous. But the combination of quality and growth provides phenomenal performance.
Take a look at the data…
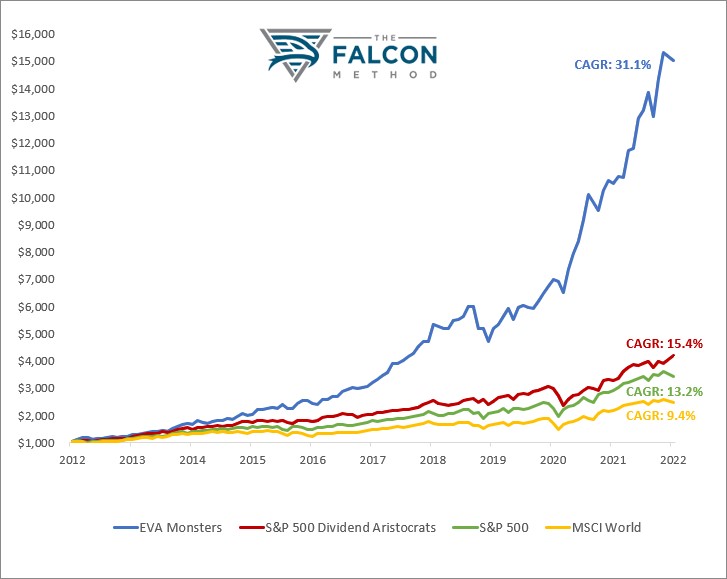
We call those companies EVA Monsters that meet all our criteria on quality and profitable growth.
To summarize, EVA Monsters have three things in common:
- They earn high returns on the capital they employ.
- They have growth opportunities that allow them to reinvest most of their cash flows at high rates of return.
- They have a sustainable competitive advantage (that Warren Buffett calls “moat”), which prevents their competitors from taking away their extraordinary profitability.
Since we are interested in the best quality-growth companies in the world, we combine our Quality and Value Scores into a Monster Score and rank all the stocks by this composite metric.
Seriously, after understanding how reinvestment at high rates drives long-term shareholder value creation, the performance chart above must not be that surprising.
You saw how much higher our EVA Monster universe ranks in terms of quality and growth compared to the market index, and you could see the mathematical proof that valuation only plays an important role in the short term, so there’s not much spectacle here.
Still, much more people call themselves long-term investors than those who really focus on quality-growth stocks. Numbers show that only the latter group follows the evidence-based way; all the others are swimming against the tide (or trying to fight the base rate, if you prefer the more scientific explanation).
Are you looking for real buy-and-hold investments? Then EVA Monsters should be your preferred category.
That said, there are only about 50 companies in the world that meet all our strict standards and are thus worthy of in-depth analysis.
With all other stocks, the underlying business is far from exceptional and thus provides less than stellar fundamental returns. Such stocks should only be purchased when the valuation is so depressed that a reasonably expected multiple expansion can propel the total return potential to appealing levels.
And they should be sold once the valuation part of the formula has played its part since you could only reap the mediocre fundamental returns of the underlying business from that point on. (More on these stocks at a later step of our process.)
Let’s keep focusing on our EVA Monsters for now and see what returns they could possibly offer.
Step#4: The windshield approach to rank the Monsters
You could argue that we have filtered and ranked thousands of companies so far solely based on backward-looking metrics that tell us little about the future.
Well, hard facts prove that the past is actually a good indicator of the future when it comes to the profitability of businesses:
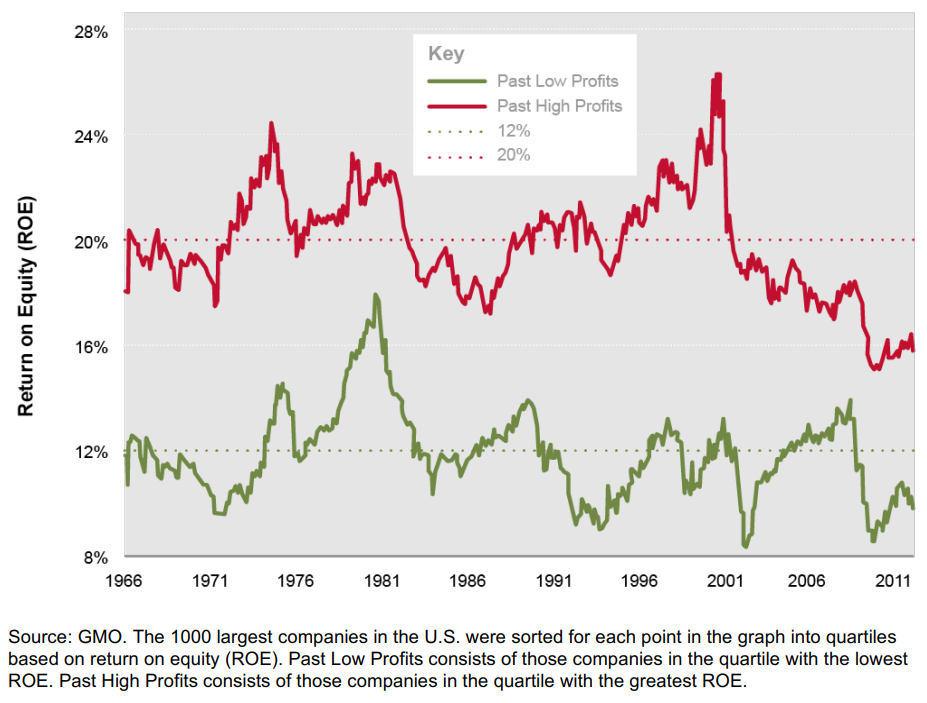
In simple terms: good companies (and sectors) seldom become bad, and vice versa. So we have an evidence-based reason to apply the filtering and ranking algorithms based on backward-looking (institutional-level) data.
Nevertheless, I agree that it is time to move on and apply a forward-looking perspective on our shortlist of EVA Monsters.
What we do in step 4 is build EVA-based financial models for this select group of companies, one by one. For this, one needs to be aware of the components of Enterprise Value in the EVA framework.
Here’s a waterfall chart to illustrate what we are modeling.
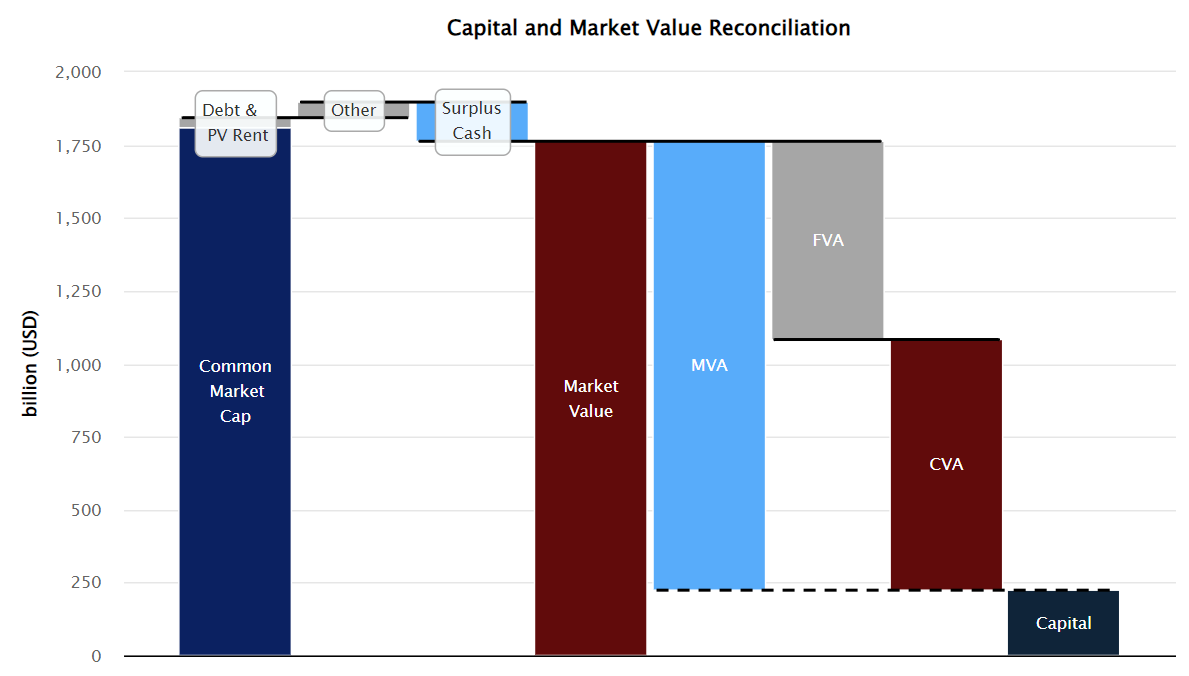
We usually start with CVA (Current Value Added), which is simply the trailing four quarters’ EVA capitalized by the company’s cost of capital.
We do have the analysts’ forecasts on sales and EVA Margin, but we tend to modify these inputs if management’s guidance or our view on the fundamentals warrants a more conservative (and very rarely a more optimistic) stance.
Multiplying sales by the EVA Margin gives us the EVA figures for 5 years out. We also have the cost of capital numbers that we almost always correct upwards since the zero-rate environment will most likely not last forever. Once we’re done, we have our CVA component.
The capital part is easy since we have forecasts that we seldom modify. (That said, most EVA Monsters are not too capital intensive, so a minor change on this line would hardly alter our conclusion.)
The remaining part, FVA (Future Value Added), is a bit tricky. It basically measures how much of the company’s current market value stems from investors’ expectations on future EVA growth.
Confession time: we have absolutely no idea what Mr. Market will think at the end of our 5-year explicit period. So we do our best and take a look at how the market tends to value the business we are analyzing.
For this, we are using the FGR (Future Growth Reliance) metric, which is simply the ratio of FVA to Market Value. FGR essentially measures what percentage of the company’s market value stems from investors’ expectations on future EVA growth.
While FVA was an absolute dollar amount, FGR is a percentage that can act as a sentiment indicator.
To give you an example, here is how Alphabet’s (GOOGL) Future Growth Reliance fluctuated since 2006:
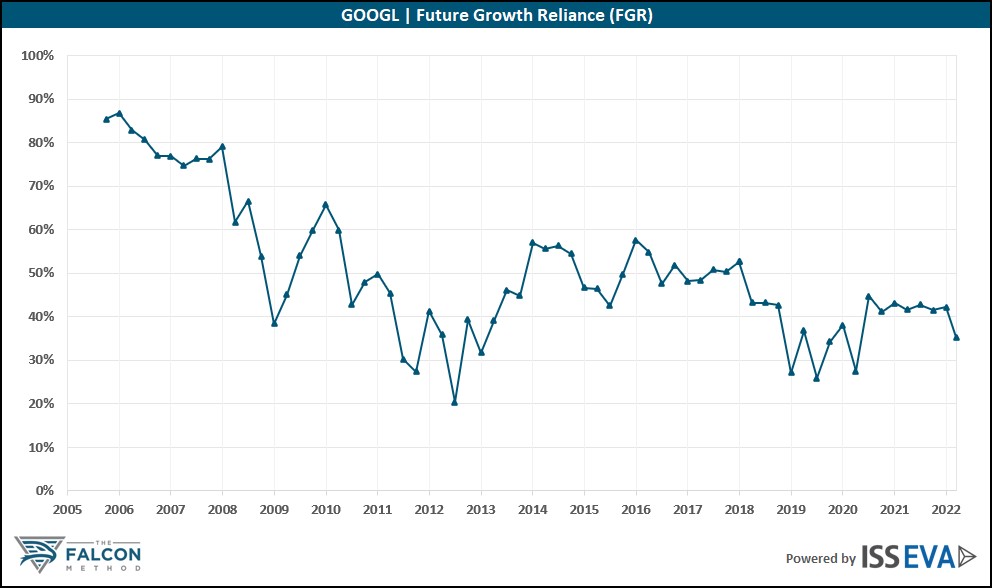
Based on the data (and our opinion whether the indicated FGR range could still make sense after 5 more years of growth), we model two scenarios: a conservative and an enterprising one.
In GOOGL’s case, let’s say that setting the FGR goalposts between 30% and 50% seems realistic at this point, so we can use these inputs to calculate the only remaining component of the Enterprise Value, the FVA. We model two scenarios, so we have two projected “exit Enterprise Value” levels.
If you take a look at the waterfall chart above, you see that the next we have to do is to get from the Enterprise Value to the Market Cap level (by adding the surplus cash, deducting debt and the present value of rents, and treating the “other” category as indicated by the chart).
Once we are done, all we have to do is add the dividends received (if any), and adjust for the effects of share repurchases or issuance based on the historical trend and management communication.
As a reward for fighting through all these details, let me show you what the result of our total return calculation would look like for GOOGL after applying the 30% and 50% FGRs.
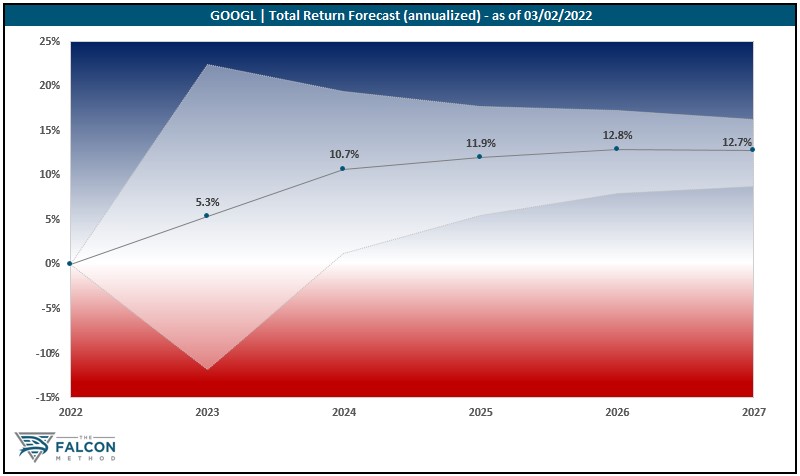
You can see a range of outcomes, and the mid-point is marked. Based on these calculations, a 12-13% annualized return seemed like a reasonable expectation from Alphabet’s stock on a 5-year timeframe at the time of the analysis.
Building such models for all ~50 EVA Monsters (and keeping them up-to-date) is labor-intensive, but it can serve as the basis for ranking these exceptional companies by their current total return potential.
While we selected the members of this elite group with the help of backward-looking data, we are using forward-looking modeling to see which of them are the most promising investment candidates and are so worthy of our time.
Much more of our time, as you’ll see at the next step…
Please note that this is a much lower quality threshold than what we applied to identify the select group of EVA Monsters.
Once we have the list of reliable dividend payers with positive EVA Margin and Momentum on various timeframes, we want to determine which of them are undervalued in historical terms.
To give you a hint on how historical undervaluation looks like, let me share H&R Block’s numbers:
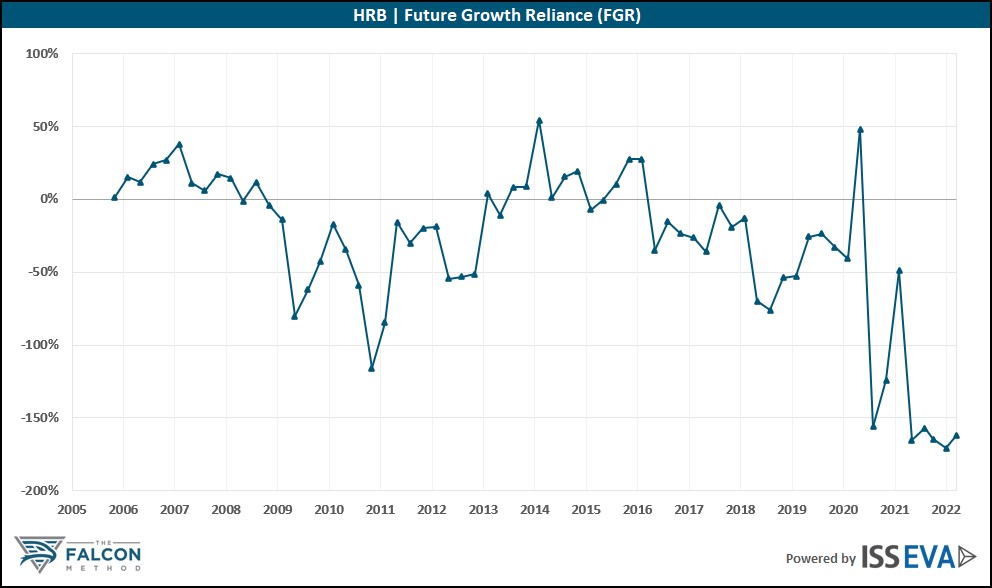
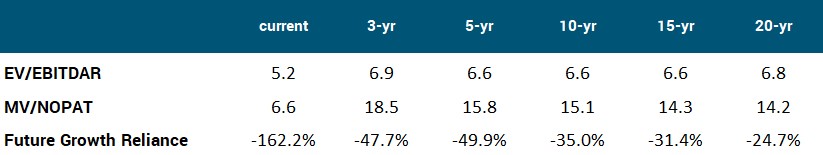
As you see, all valuation metrics were lower than the averages on various timeframes when the data was retrieved.
At the FALCON Method, we always examine valuation from a multidimensional perspective, employing at least three different indicators.
Those stocks that pass this hurdle are ranked based on our composite Angel Score that measures the level of historical undervaluation and also gives some weight to business quality.
The higher the quality and more depressed the valuation, the better the investment opportunity, and the higher the stock ranks.
In this sub-segment, we expect the majority of our total return to come from the expansion of the valuation multiple while we are collecting the dividends, but we don’t anticipate too much growth in business fundamentals.
While the quality and growth factors played the most important part with EVA Monsters, it is the valuation that drives returns with these once-beloved dividend darlings that landed in the bargain bin. This describes perfectly why we call this category Fallen Angels.
As you saw, with Fallen Angels, once the valuation multiple reverted to its mean or even overshot to the upside, there is not much one should wait for with selling.
You can call on the dividend yield theory or use valuation metrics like the NOPAT yield or Future Growth Reliance to get a picture on when to sell.
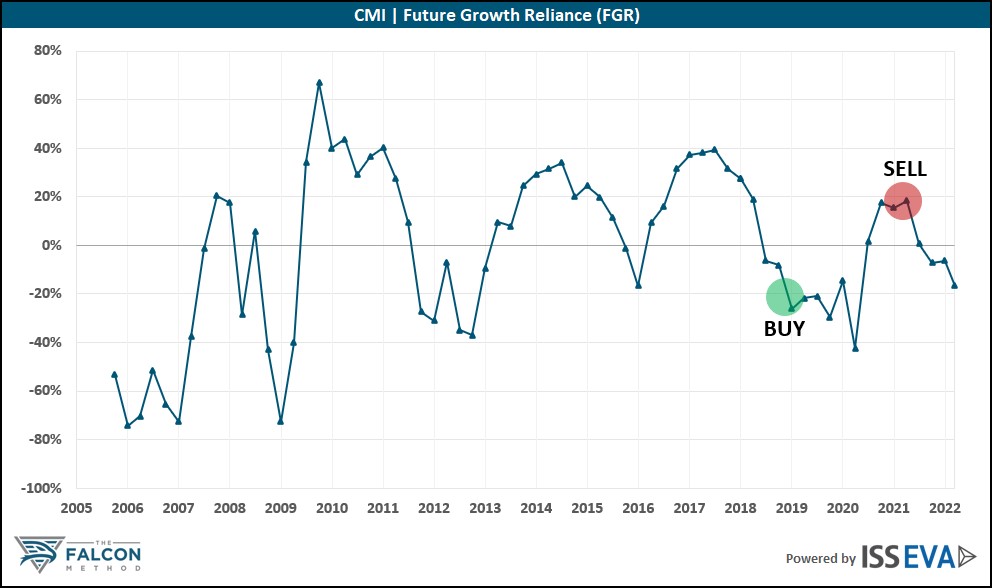
As for the FALCON Method, we send out sell alerts to our subscribers so they knew exactly when we thought Cummins (CMI) stock was ripe for selling, for example.
The Future Growth Reliance indicator underscored our buy and sell decisions…
… and Morningstar’s analysts also seemed to agree with us:

At the FALCON Method, we only look at third-party opinion to complement our independent analysis. That said, it is always good to see everything pointing in the same direction.
As for EVA Monsters, a “longer leash approach” is warranted since the majority of our returns stem from the growth component (the combination of the reinvestment rate and the return on that newly invested capital), and the longer the holding period, the less important the role of the valuation multiple becomes.
In summary: we keep our Fallen Angel positions on a relatively short leash and sell when they approach fair value, while EVA Monsters need that kind of extendable, longer leash since the valuation multiple is not the major part of our total return as long as the “Monster characteristics” remain intact.
When do we sell EVA Monsters?
- When the business characteristics change and the Monster thesis seems broken.
- When (1) the valuation got so high that the forward-looking total return potential sank to a mediocre level, AND (2) we managed to identify a better investment opportunity, which is absolutely not inferior in terms of quality and growth prospects.
You may want to reread the latter point a couple of times since all the criteria mentioned are vitally important.
My experience says that selling an EVA Monster almost always proves to be a mistake unless the business deteriorates meaningfully.
I know that for most people, it is hard to get over the psychological pressure to always do something just to feel worthy. Yet practicing inactivity pays off…
In Alice in Wonderland, one had to run fast to stand still. In the stock market, one who buys right must stand still to run fast.
We have a well-structured, evidence-based investment process to address cognitive biases and psychological issues. Let me round this piece off with one of my favorite quotes:
“If you can’t describe what you are doing as a process, you don’t know what you’re doing.” W. Edwards Deming
Have you fallen in love with the process? Here’s what to do…
Now that you are familiar with the FALCON Method stock selection process, basically, you have 3+1 choices:
- You can close this article, do nothing, and stick to your regular method for selecting stocks. If you decide to do this, we wish you the best!
- You can grab the opportunity to incorporate all this work, knowledge, and institutional data into your own selection process by subscribing to the FALCON Newsletter here.
- Or, if you want to dig deeper and learn more, you can take part in our Free Webinar, where we teach you even more about how EVA is calculated, and we give you a backstage view on how our FALCON Method process works in practice.
- (Essentially, nothing can stop you from selecting options 2 and 3 as well. This means you can get both the knowledge you crave and deserve and our TOP 10 stock picks every month with a click of a button.)
If you wish to learn more about the FALCON Method Newsletter service, click here!
If you want to learn more and get our FREE 90-minute webinar on stock investing, click this link!
