To understand this piece of content, you must be familiar with the most important problems of the income statement and the balance sheet.
You have to accept the fact that accounting is not meant to help investors but to calculate taxes. Therefore accounting numbers are easily manipulated, and any multiple based on these reports is misleading and dangerous.
We have a whole article about proving these points; please, if you haven’t already, read it here:
Is That Stock Attractively Valued? Your Beloved Multiples May Fool You.
Just to recap things:
- Accounting treats shareholders’ equity as free money (distorts earnings)
- Accounting treats two identical investment decisions differently (distorts earnings)
- Accounting provides ample room for management to play with certain items (distorts cash flow)
- P/E, P/FCF, P/EBITDA, P/BV, ROI, and ROIC are also badly distorted, thus not suitable to base serious investment decisions on them
- Even the PRICE component in the commonly used multiples leads to distortions because of differences in capital structures (distorts all multiples using the P component)
- Earnings growth can be high and still lead to shareholder value destruction (Not all growth is good)
We have a lot of data from accounting that we can use, but NOT in the raw form accountants and quarterly reports show them.
As Warren Buffett wrote to Berkshire shareholders:
“Managers and investors alike must understand that accounting numbers are the beginning, not the end, of business valuation.”
The financial statements you can readily access should only be the starting point of your business analysis. Thoughtful investors have a lot of work to remedy these serious accounting distortions.
This is also crucial because today, with all the data at our fingertips, everyone is using the same multiples from the same websites, so it has become almost impossible to find an edge when valuing companies.
But those investors who can remedy these distortions and therefore come up with better fair value estimates are gaining an enormous advantage.
Let’s see how…
Where the TRUE profits are made
Since I put down my managing director position and sold my firm, I kept devouring books to explore every possible evidence-based way of wealth building and to get better and more confident investing my money.

After reading hundreds and hundreds of books on investing, in 2018, I came across a life-changing book while traveling to compete at IRONMAN Barcelona.
It was Best‑Practice EVA by Bennett Stewart and was so hard to read that I literally suffered through the 300 pages.
Still, it felt obvious that Stewart’s message about EVA (Economic Value Added), which is the true profit a business makes after several adjustments to its misleading financial statements, makes a ton of sense.
The main goal of EVA is to show you whether a company is creating value by earning more than its true cost of capital or not. (Surprisingly, about half of the publicly traded companies belong to the latter group.)
In the quest to discover this, addressing all the distortions of GAAP accounting one by one is inevitable. The EVA framework does just that.
EVA is the real value the company created in a particular year after addressing all accounting distortions. It’s not an accounting term, and you won’t find it on the income statement or the quarterly reports.
This is a TRUE PROFIT METRIC we have to calculate. To get to this true profit number, we do not have to start from scratch; that would be way too impractical and too much work. But we have to make the necessary corrective adjustments to arrive at the real economic profit of a business.
How to get to the EVA?
In simple terms, EVA is a metric that measures the firm’s profit remaining after:
- Deducting all costs adjusted for accounting distortions one by one
- Including the cost of giving the firm’s investors a full, fair, and competitive return on their investment in the business.
EVA is a comprehensive net profit score that charges for all capital used, including shareholders’ equity, which is falsely considered free money under GAAP accounting.
EVA is far superior to EPS or Free Cash Flow; in fact, charging for all capital makes EVA the most demanding profit performance measure and the number one choice for investors with a long-term business owner mentality.
Let me emphasize this again: EVA is very strict and sets the bar as high as possible.
Although Warren Buffett has never used the trademarked term EVA (Economic Value Added) in his letters, he keeps emphasizing the importance of the “money’s-not-free approach.”
EVA is sales less operating costs (adjusted for distortions) less the full cost of financing business assets as if the assets had been rented.
To be exact, there are at least 15 different accounting distortions that are corrected by the EVA framework. We already talked about the capital being free and the R&D investments.
But there are many more, like deferred taxes, managing leased assets, correcting impairment charges, operating reserves that need to be addressed, and many more nuances I do not want to cover here since it could fill a book alone.
In fact, there is a book about it called Best Practice EVA. But if you are curious about the details now, you can look at our list of the 15 most important accounting distortions here.
Case study: How good is EVA?
In the EVA framework, the company is earning a positive economic profit only after covering all resource costs, something that is true of only about half of the public companies in the economy at any time.
(Read it again: it is not at all evident that companies are earning adequate returns on the capital they employ. More companies are profitable in the accounting sense than those who can outearn their true cost of capital, with the equity portion included.)
Take a look at Whirlpool between 2013 and 2019!
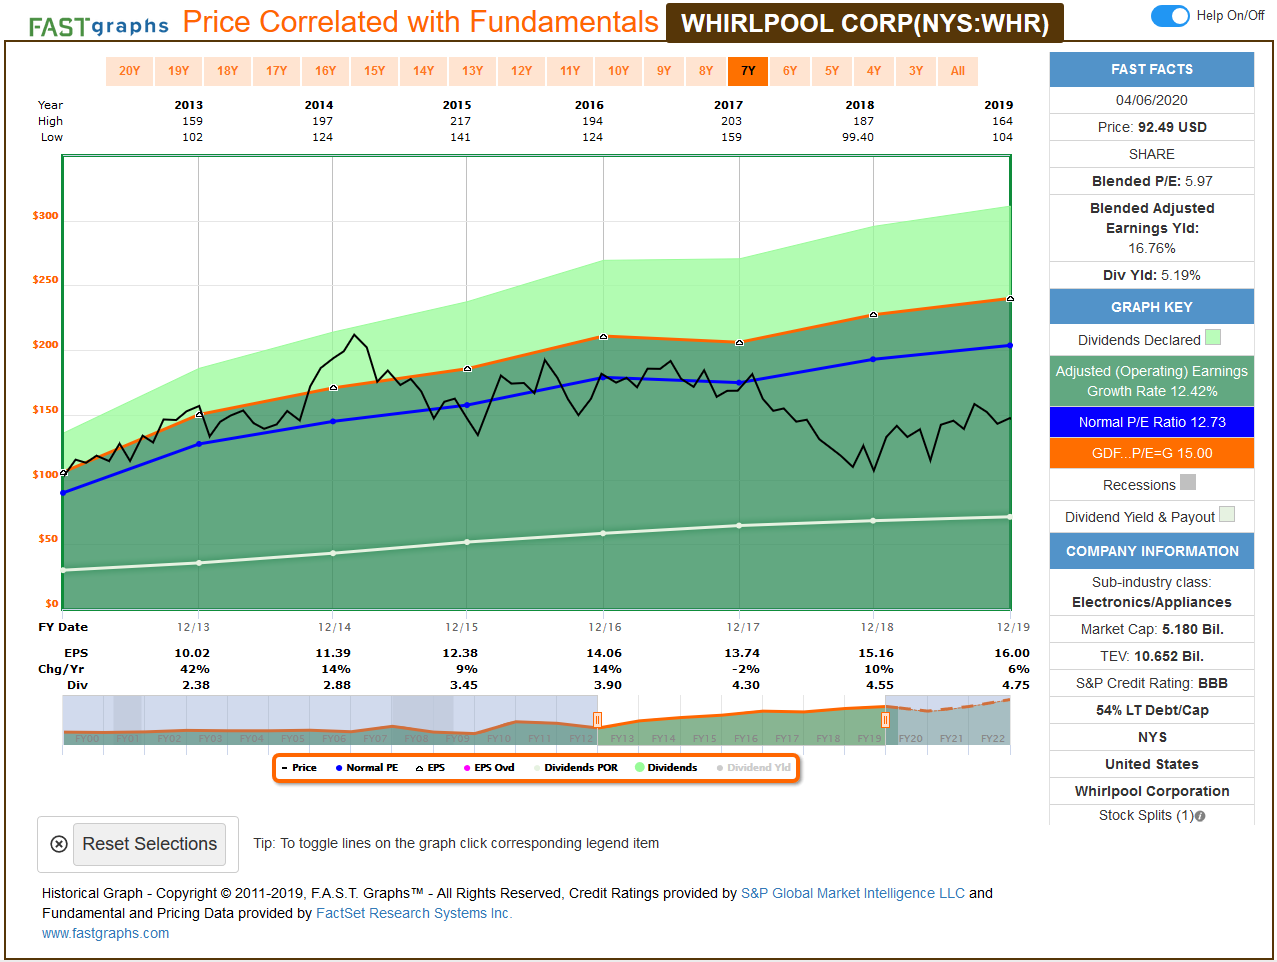
As you see, earnings per share shows a nice increase almost every year between 2013 and 2019 (from $10 to $16), yet the stock price (the black line) is moving sideways. EVA shows you the reason:
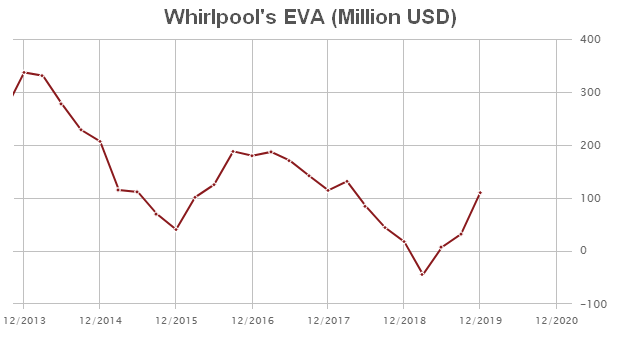
Wherever EVA goes, the share price follows. (It’s proved by statistical methods, just keep on reading…)
We can create an “EVA Income Statement,” which is similar to the traditional income statement but meant to serve investors. These numbers are adjusted for accounting distortions and thus show the real economic profit investors should focus on instead of the traditional “earnings” meant for accountants.
Let’s take a look at Whirlpool’s numbers, and discuss why the stock price did not move:

While EPS exhibited growth, the increase in EVA (real value creation) was not that clear, to say the least. This is a classic example of where EVA and EPS differ, and EVA wins the argument.
That said, I came across a white paper which revealed the true relationship between the EVA-based shareholder return predictions and the actual shareholder returns. (TSR stands for Total Shareholder Return in the chart below.)
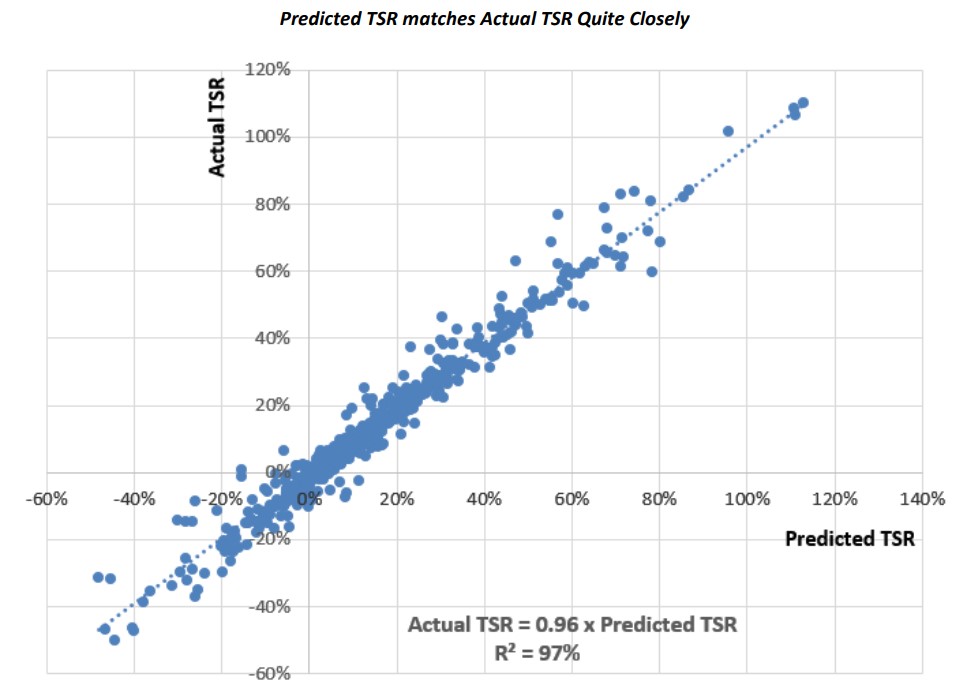
Source: The Link Between TSR and EVA, Bennett Stewart
The results are MIND BLOWING. The graph shows how close the predictions to the actual returns were. You can see that the predictions were almost 100% percent spot-on!
Once more: EVA is the TRUE economic profit that the company makes in a given year. This is what long-term investors should focus on, and this has the best predictive ability among all the different metrics.
That said, we have data to compare different performance metrics in their predictive ability of MVA.
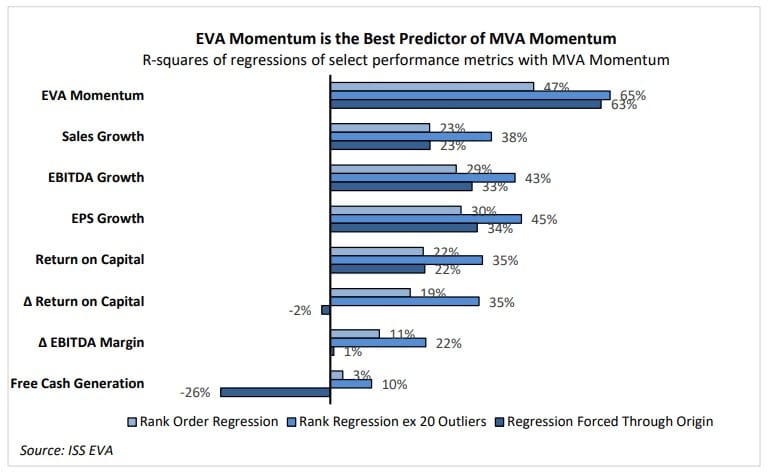
MVA is a very significant measure, more important than Total Shareholder Return in many ways. MVA indicates how much wealth a company has created for its owners by comparing the cash that investors have put or left in the business with the present value of the cash they can expect to take out of it. MVA also measures a firm’s franchise value.
Without going into the details now, you can see from this graph that EVA momentum (which is just change in EVA divided by sales) is the best predictor of a business’s value creation.
How Does the EVA Framework Measure Valuation?
When it comes to valuation, I tend to prefer a complex approach instead of going with one single multiple or metric.
At the FALCON Method, we are using two distortion-free multiples (EV/EBITDAR and MV/NOPAT) and an EVA-based indicator (Future Growth Reliance) to assess a stock’s current valuation in historical comparison.
I am going to explain them one by one…
FGR: How much growth is priced in the shares?
As expectations about future value creation are a driver of the stock’s valuation, it’s time to dissect the components of value in the EVA framework so that we can see what expectations are reflected in the current stock prices.
Remember: EVA is the real value the business created for its investors. The more the EVA, the better the performance. In contrast to earnings or cash flow, EVA takes the distortions of GAAP accounting into account.
For quantifying the expectations for future growth in EVA, we can use the so-called Future Growth Reliance ratio. I deliberately simplify here just to get the point through as easily as possible.
Below you can see how these components make up the Market Value and how we can get from this enterprise-level metric to the market cap.
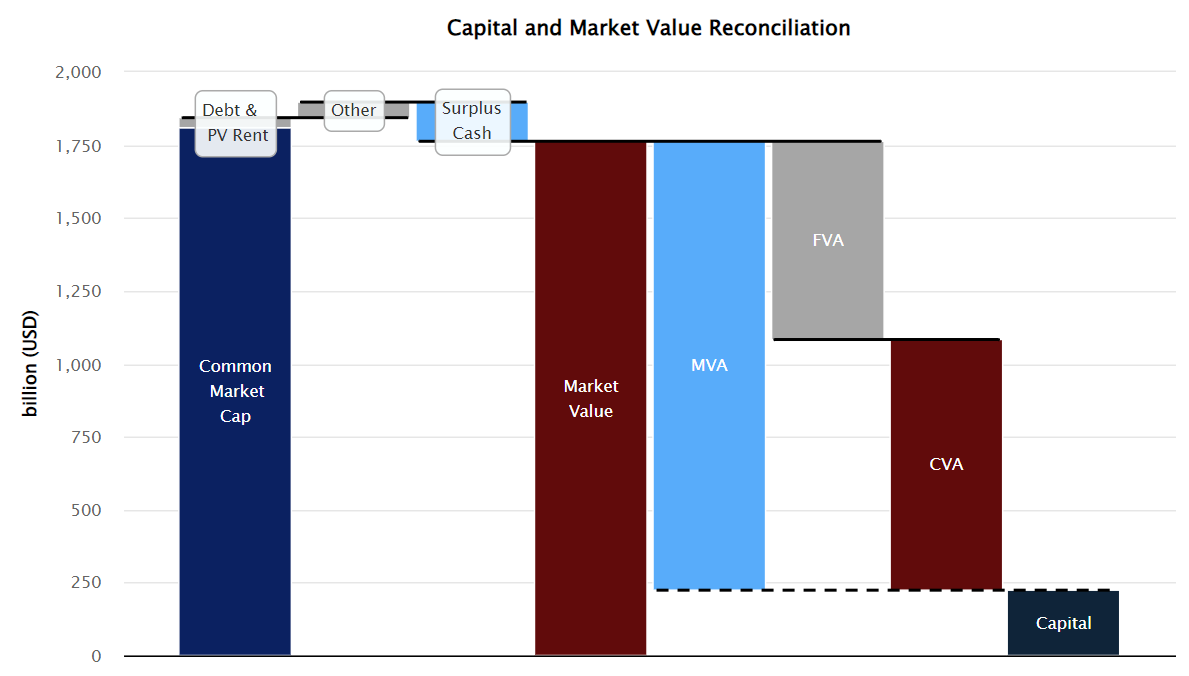
A firm’s market value consists of the following components:
- Capital: That includes all capital invested in the business, including working capital, net property, plant, and equipment, the present value of rents, intangible capital, and several capital adjustments.
- Current Value Added (CVA): The value derived from capitalizing current level EVA at the cost of capital in perpetuity. In practice, this is trailing 4-quarter EVA divided by the cost of capital (i.e., a zero-growth EVA perpetuity). This comes from assuming that the firm’s EVA remains constant forever.
- Future Value Added (FVA): The present value of the expected growth or decline in EVA. When a stock has negative FVA, investors expect EVA to decline from its current level and vice versa.
- MVA stands for Market Value Added and is the sum of CVA and FVA. MVA essentially measures how much more the company is worth than the capital that has been put in.
There is a way to derive FVA from share prices. This means we can calculate the ratio of the firm’s market value that is derived from and depends on future growth. (Measured in EVA, of course.)
This percentage value is called the Future Growth Reliance (FGR), which is just the ratio of FVA to market value.
In other words, Future Growth Reliance is the percentage of the market value that comes from future expectations and is yet to be realized.
So basically, FGR shows how much of the stock’s current market value stems from the expectations about future EVA growth.
For example, the FGR ratio of 20% says that the firm’s market value would tumble by 20% if investors became convinced that it would never be able to increase EVA above its current level.
A negative FGR ratio signals that the market is discounting the stock’s current level of EVA, indicating an expectation for future headwinds.
Let me put it this way: if the FGR equals -50%, but as an investor, you are convinced that the firm will be able to produce better results (higher EVA) than the current level, then you may have found an undervalued stock. (You shouldn’t pull the trigger just yet, but it’s a good sign.)
We mainly use the FGR for historical comparison, but this metric also comes in handy when setting the limits of the reasonable valuation range with our total return calculation.
To sum up, a higher FGR ratio indicates a higher valuation. We want to buy our top-quality stock targets when this sentiment indicator is low.
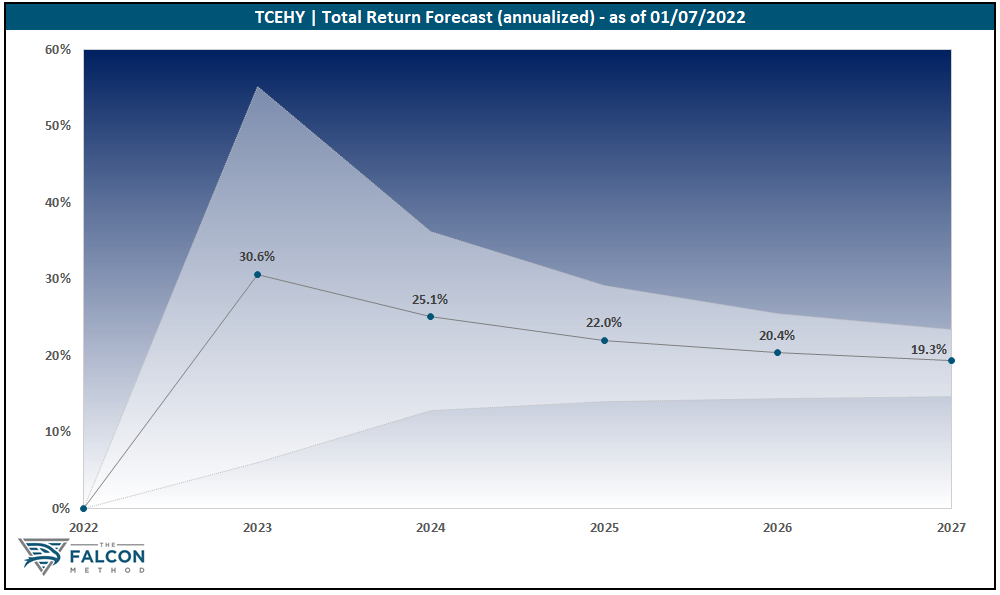
Here’s a short sample from the newsletter’s analysis on Tencent with the stock’s Future Growth Reliance presented below:
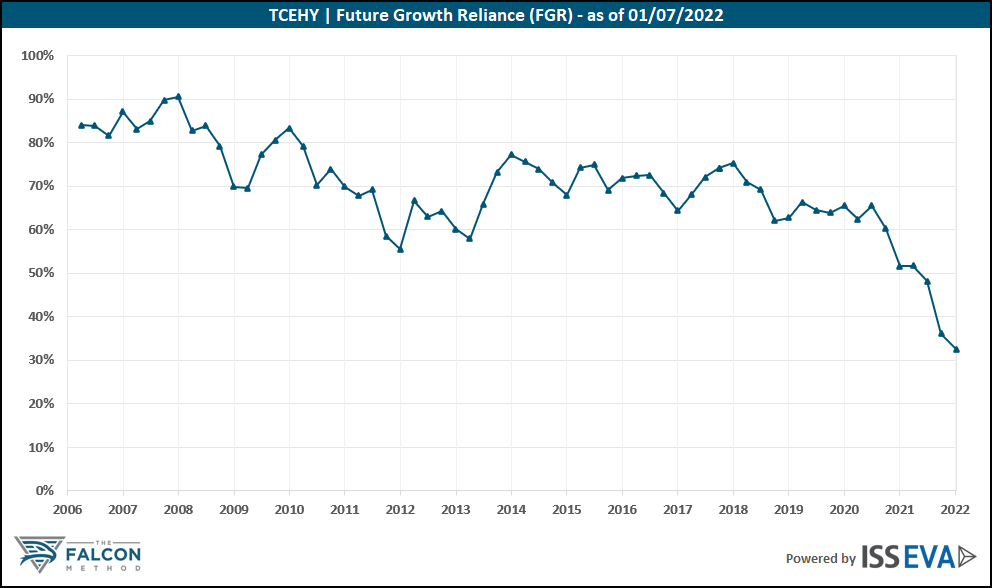
No matter how you look at it, the stock seemed to be attractively valued historically (at the time of publication) since the lower these metrics, the more pessimistic the valuation.
Two more valuation metrics
Since it’s always useful to inspect a company from more angles, besides Future Growth Reliance, we employ two other distortion-free multiples.
These are EV/EBITDAR and MV/NOPAT.
Numerators first…
EV and MV stand for enterprise value and market value, which are essentially the same, but the EVA guys are using two different labels for some reason.
EV or MV equals the value of the stock’s debt and equity capital, given its share price, net of excess cash, and assuming that the book value of liabilities approximates their market value.
Simply put, EV or MV equals: market cap + total debt – surplus cash.
We proved earlier that the “P” in multiples like P/E could be misleading when the company has any debt – which they usually do. By using EV or MV in our multiples instead of the PRICE, differences in capital structure will not distort our assessment.
So let’s see the denominators…
After corrective adjustments to remedy accounting distortions, NOPAT measures the free cash flow from operations that is distributable after ensuring that tangible and intangible assets needed to sustain the profit can be replenished.
EBITDAR is an improved version of the widely used EBITDA metric as it includes add-backs like rent expenses, R&D, and advertising spending.
Both the NOPAT and EBITDAR multiples are useful and highly-enhanced versions of the commonly used valuation multiples.
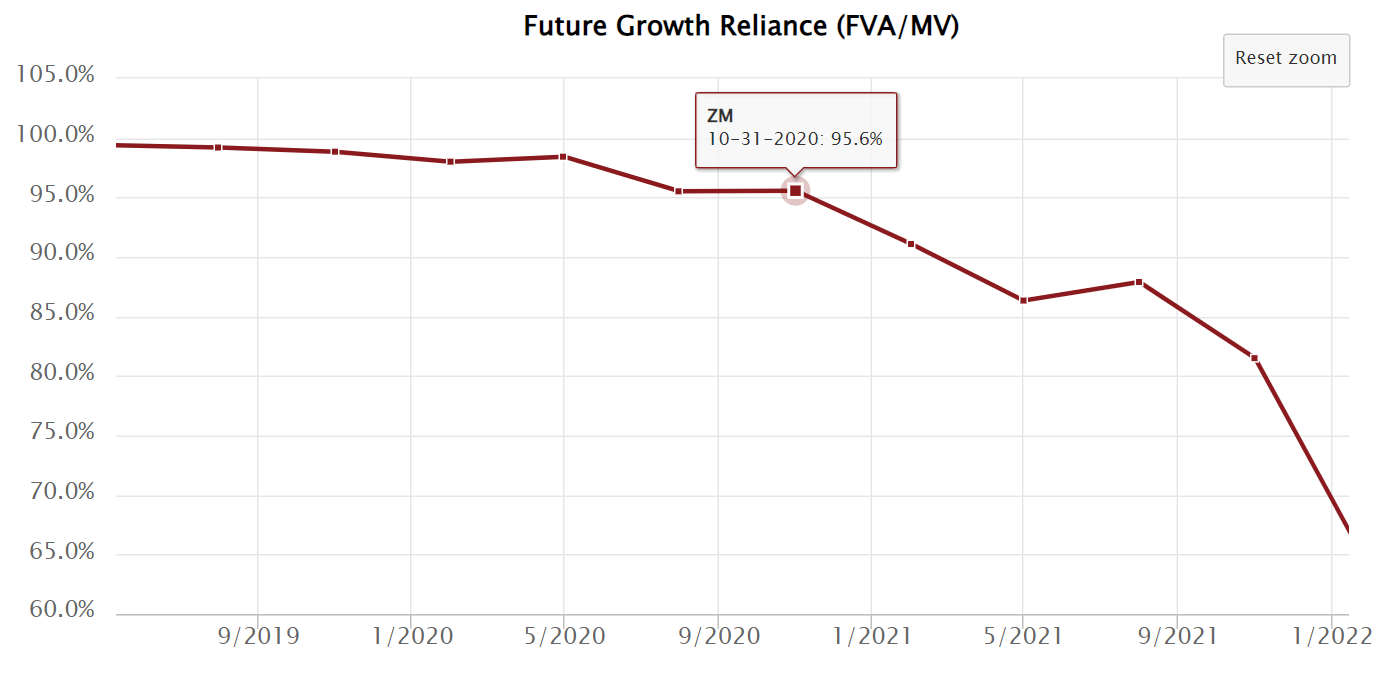
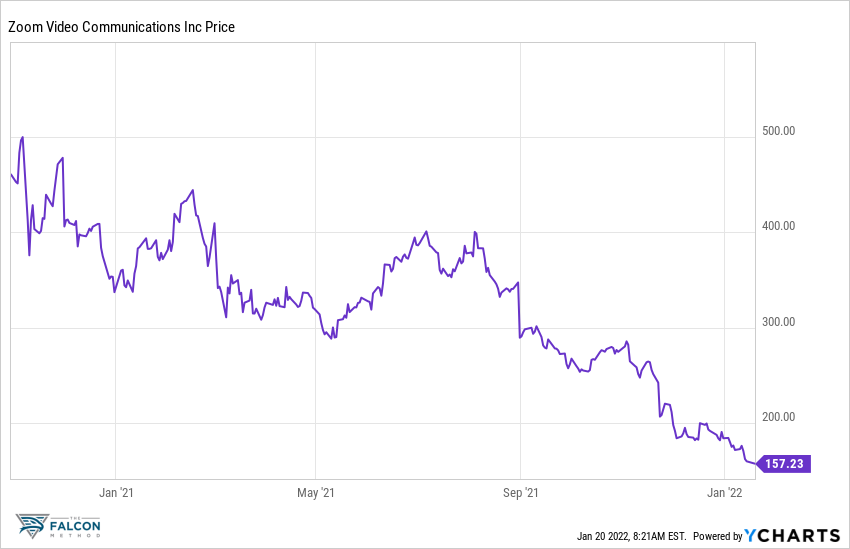
Two Eye-Opening Examples
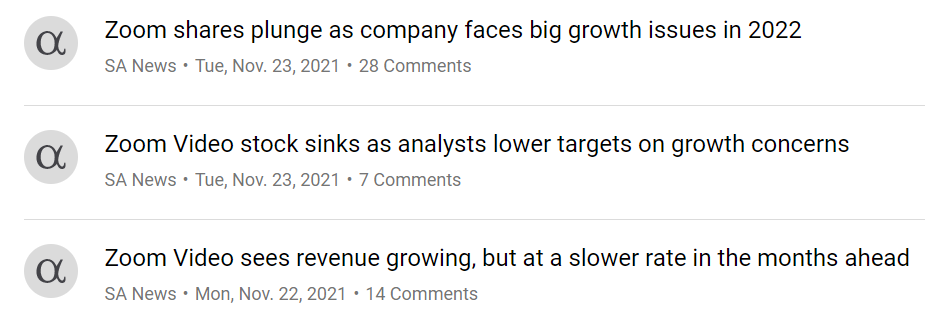
The case of Zoom Video Communications (ZM) shows that it is easy to disappoint when essentially all the company’s value stems from future growth expectations.
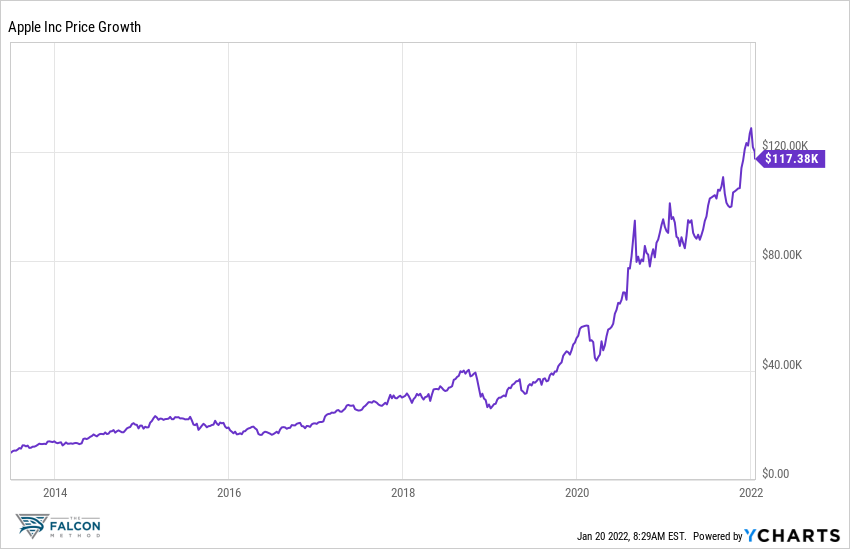
On the other hand, Apple’s example shows that even wonderful companies can be bought at astonishingly attractive valuations.
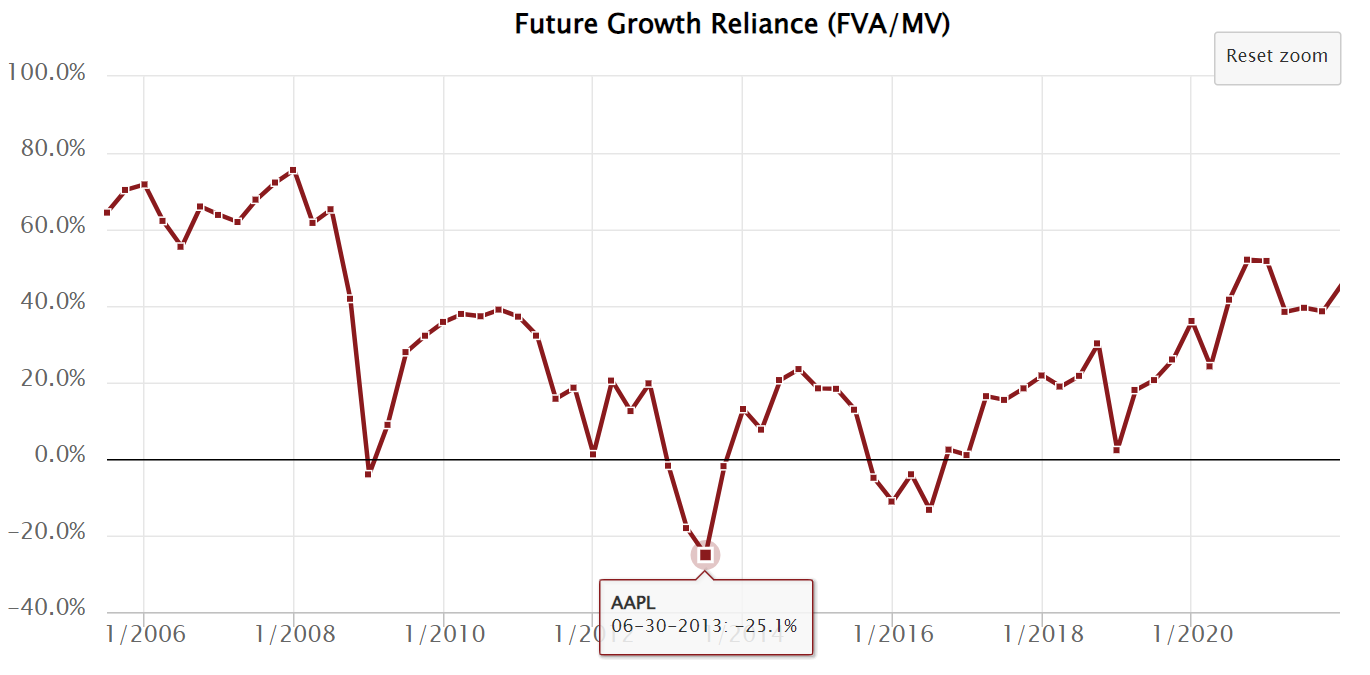
The negative FGR means that the market was not only pricing in zero growth but even predicted value destruction. Investing $10K in Apple in June 2013 at the point of extreme pessimism would have netted you a ~12x result as of January 2022.
Using top-quality data pays off big time! Now let me show you something really interesting…
EVA for Everyone? Really?
I used to be a devoted dividend investor – I even wrote 2 books on the topic – but after discovering all the above, I started to pay more attention to the most important component of total return: EVA growth.
When compiling the FALCON Method newsletter’s list of Top 10 stocks, we are building EVA-based financial models to calculate a reasonable range for every stock’s annualized total return potential.
After reading the annual reports, earnings call transcripts, and watching management’s presentations; we feed our models with input data like analysts’ expectations on sales and margins, dividends, share buybacks, and historical valuation multiples.
We build both a conservative and an enterprising scenario to arrive at a range of results, as shown in the chart below.
Nobody knows the future, so thinking in ranges is the only sensible way to go. When you see numbers in the neighborhood of 20% while having a total return requirement of 12-15%, you know you have a significant cushion (a margin of safety) built in.
That said, we tend to be cautious when putting together the underlying models, so when the potential total return figures are this high after applying the margin of safety principle at every preceding step of the process, we know we are on to something promising.
We are looking for the best of the best quality companies (based on EVA metrics) with substantial projects to reinvest their earnings with high returns. This exceptionally good combination is rare but finding those pays off.
We call these companies EVA Monsters, and you can see their returns compared to some well-known indexes.
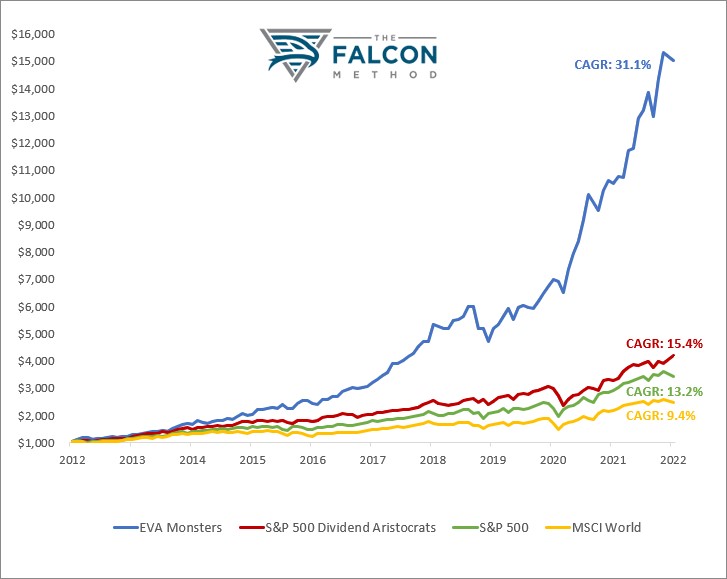
Regardless of your investment style, I firmly believe that the EVA framework has something to offer you.
For dividend investors, it may be worth taking notice that wherever EVA goes, the stock price follows; and it is also nice to earn great total returns while harvesting those reliable dividends.
See for yourself on the chart below.

Where EVA growth was lackluster, the share price went nowhere in the examined 5-year period, and dividend growth rates were also unimpressive.
On the other hand, dynamic EVA expansion entailed exceptional share price performance and dividend growth in the case of Domino’s and BlackRock. My preference is with EVA growers…
For hardcore value investors, EVA can help avoid value trap situations.
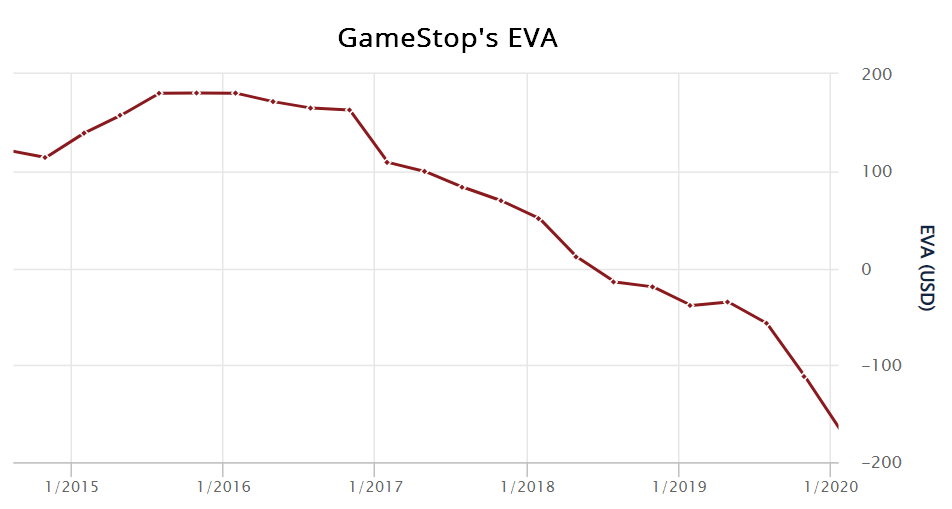
Investing in melting ice cubes that always look cheap all the way down to zero is the most costly mistake a value investor can make, and here comes EVA to the rescue, as shown in GameStop’s case study.
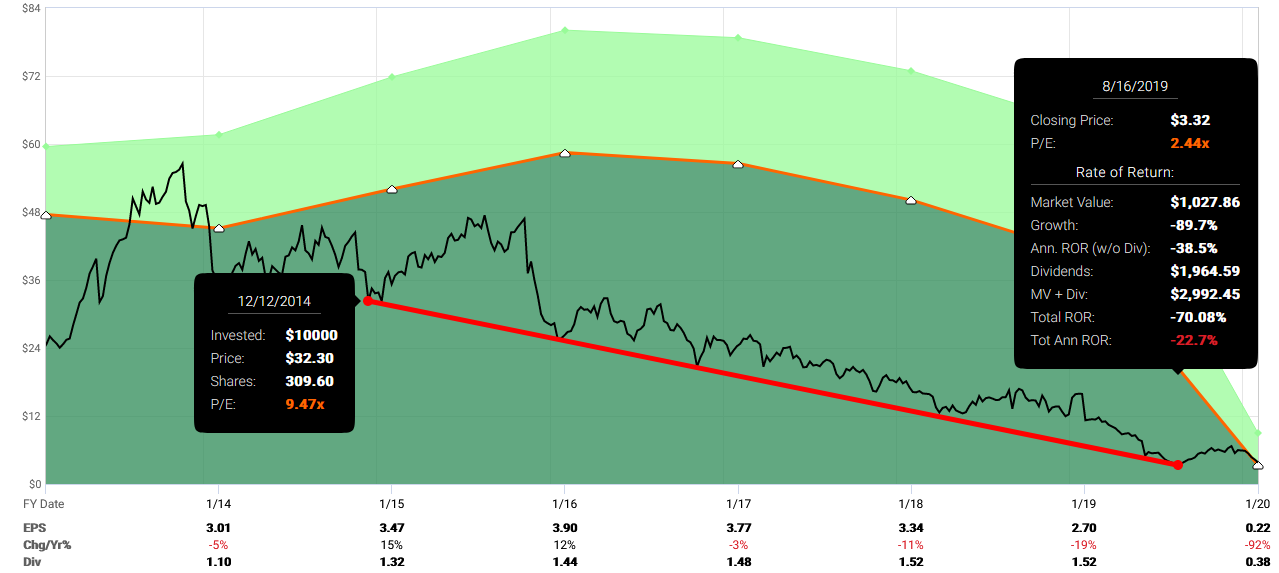
You can see that traditional, widely-used metrics like P/E showed that GME stock was cheap all the way down from $32 to $3.
Earnings per share was not there to guide your decision-making, while EVA acted as the canary in the coal mine and would have convinced you to steer clear of this value trap situation.
Last but not least, for growth investors, it comes in handy that EVA lets you separate the wheat from the chaff; thus, you can focus on the time-tested category of quality-growth stocks instead of buying all the speculative, cyclical “pure growth” names out there.
As the EVA concept highlights, only that type of growth creates shareholder value where the company earns a higher return on its growth projects than the true cost of the capital needed to finance those projects. All else classifies as value-destructive growth, and you’ll want to steer clear of those companies where management’s empire-building ambitions take priority over creating shareholder value.
I am ready to admit that after rereading the EVA book 5 or 6 times and diving deep into ISS’ institutional-level data, I wouldn’t make an investment decision without looking at the EVA metrics of the company I’m analyzing.
The only obstacle is that EVA data is probably too expensive for small investors.
Of course, there is a do-it-yourself way to calculate EVA, but as soon as you gain an in-depth understanding of all the accounting distortions and the accompanying remedies, you will most likely feel that it would take an unreasonable amount of your time.
I am grateful that the FALCON Method newsletter business made it possible for me to access the EVA database, evolve further, and take a giant step as an investor.
Thanks to this, anyone who subscribes to the Falcon Method Newsletter can profit from this data, which would otherwise be only available to those with exceptionally large capital.
With the help of the EVA data, I could repay my subscribers’ trust by taking the newsletter service to the next level, making 1000+ of them even more satisfied.
(We have a ~95% subscriber retention rate as I write this, which is considered exceptional in an industry with a standard rate between 70-80%.)
At the FALCON Method, we are using the EVA framework to identify the couple dozens of truly exceptional quality-growth companies worldwide (we call this category EVA Monsters, as shown on the chart above), and we are also continuously monitoring the market for reliable dividend payers with attractive total return potential (we call them Fallen Angels).
Our subscribers get the best of both worlds within the same service, so they can have their dividend income without compromising on total returns.
Makes sense? You can learn more about the FALCON Method here and see how you can make institutional-level decisions for a price that is affordable to individual investors.
Do you enjoy learning about investing? Then you will love our free webinar about EVA-based stock investing.
