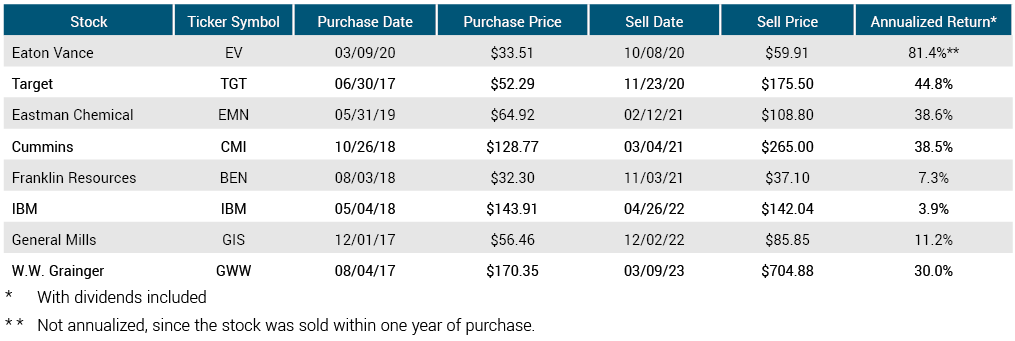
W.W. Grainger (GWW) first appeared in the FALCON Method newsletter in August 2017 when we bought the stock at $170.35. Fast forward ~5.5 years to March 2023, when we exited this position at $704.88, realizing an annualized total return of 30.0%. This equals turning $10K into $43.4K, including dividends harvested. No victory lap here; I’d rather like to illustrate the thought process behind both the buy and sell decisions to provide some value for thoughtful long-term investors.
What we knew back in 2017
Grainger was a Dividend Champion with a 46-year dividend-raising streak, so it comfortably qualified as a reliable income vehicle.
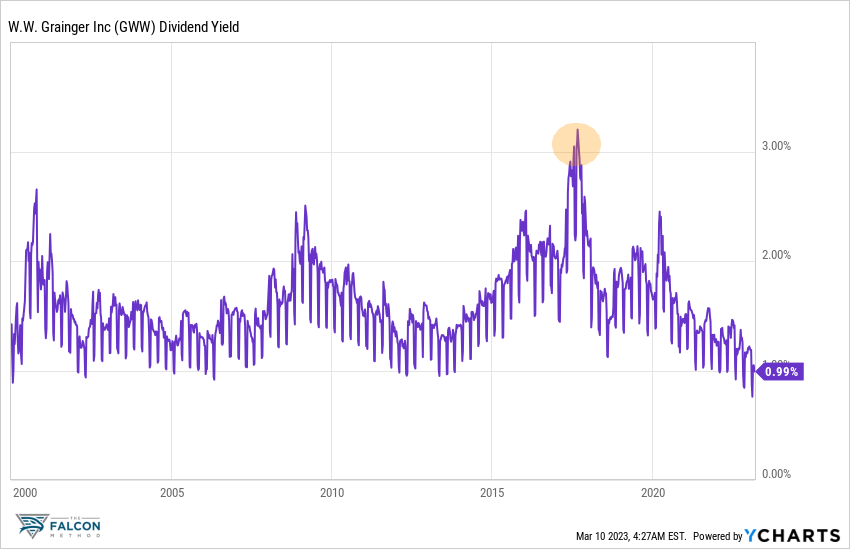
The stock offered a 3% entry yield, a rare opportunity in historical context.
The financial metrics revealed that Grainger was an above-average company, most likely facing temporary headwinds. Mr. Market was quick to write off the firm as Amazon seemed to disrupt its business model. As a reaction, Grainger scaled down the number of stores and ramped up distribution centers to grow their e-commerce business. Management believed their operating margin would decline in 2017 and 2018 but begin to grow again in 2019.
Back then, I wrote: “Given the company’s outstanding relations with its customers and the valuable services it provides, it doesn’t have to be the cheapest to stay alive. While a lot of retailers are currently fighting declining sales and struggling to get rid of their inventories, Grainger’s top line is actually rising each year while the inventory stays virtually unchanged. Demand for the firm’s products is still strong. GWW is the epitome of the selective contrarian buy for me. If you believe its business will not be totally commoditized by Amazon, this is a stock you should definitely own. I foresee an annualized total return between 9-12% in the overly conservative scenarios I examined.”
In hindsight, I was way too conservative with that forecast, but better safe than sorry. My short assessment from the August 2017 issue of the newsletter read: “Whenever Grainger offered a starting yield above 3%, the total returns that followed were extraordinary. Coverage ratios are fine, and even with a temporary (?) slowing growth, this stock can be the cornerstone of a portfolio that focuses on reliable dividends.”
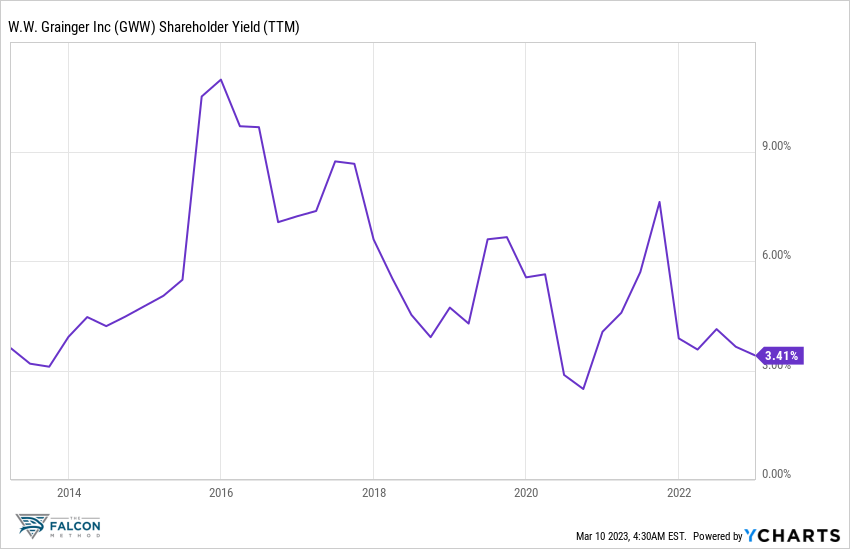
The shareholder yield (the sum of the dividend, net buyback, and net debt paydown) sat at 10.0%, making me even more comfortable with this purchase, resulting in a somewhat oversized position.
The Patient Holding Phase
Let’s take a look at how Grainger’s business performed during our holding period.
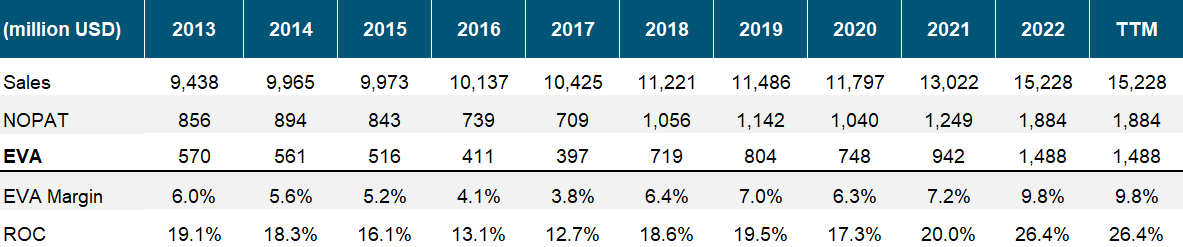
As you see, sales increased by ~50%. What’s much more impressive, though, is the margin performance. At the time of our purchase, the firm could convert 3.8% of its top line into real profits (Economic Value Added, cleared from all accounting distortions, as you can learn here). By the time we sold Grainger, its EVA Margin had shot up to ~10%. The company’s management was right about the margin trajectory.
More EVA production tends to entail higher stock prices, and Grainger didn’t embarrass in this regard. Look at how the red bars increased in lockstep with the company’s market value.
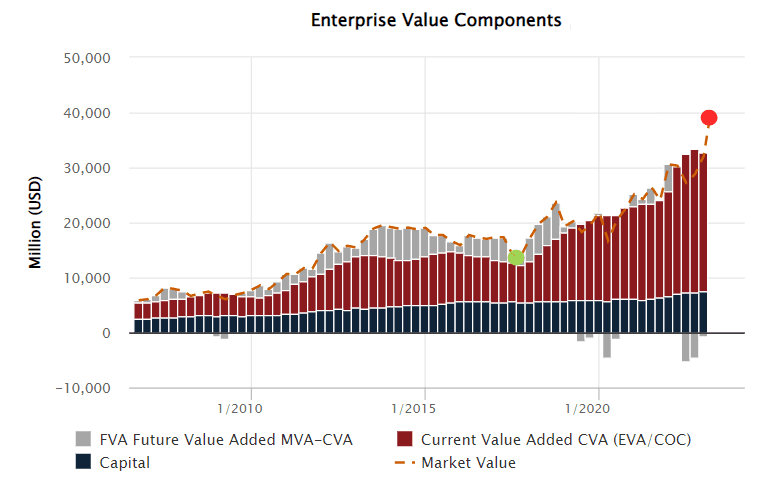
You can learn more about the Enterprise Value Components from this piece.
Grainger also delivered on the dividend front, announcing annual increases like clockwork.
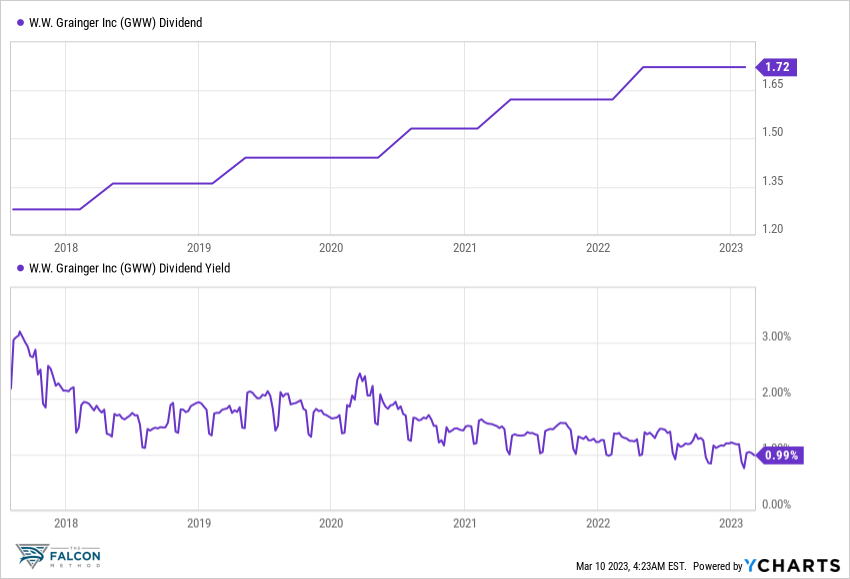
While all was well on the fundamental side of the business, the stock’s valuation became somewhat concerning as Mr. Market changed his tune on Grainger.
Why we sold
In general, we have two main reasons to sell: (1) the fundamentals don’t work out as expected, so the investment thesis seems broken, or (2) the stock gets overvalued, from which level the forward total return potential becomes muted and the risk-reward characteristics unfavorable.
In Grainger’s case, the first explanation doesn’t apply, as the company grossly outperformed our expectations on the fundamental business performance front. As for the valuation side, at a $700+ level, it became almost impossible to justify holding GWW any longer.
Besides doing our independent EVA-based financial modeling, we also tend to look at external sources before making sell decisions like this. Morningstar considers Grainger significantly overvalued over $635. (This was their one-star price when we sold the stock.) Based on the historical dividend yield profile, one could argue that GWW was a sell above $550. So why didn’t we exit this position sooner?
Because Grainger was a Fallen Angel pick of above-average quality, and dumping such stocks too soon usually comes back to bite you. (Back when we didn’t differentiate between EVA Monsters and Fallen Angels, I sold Microsoft on a historical valuation basis instead of looking at its formidable forward total return potential. Lessons learned. By the way, you can learn about our EVA Monster vs. Fallen Angel classification here.)
Here is what we saw with Grainger at the time we sold:
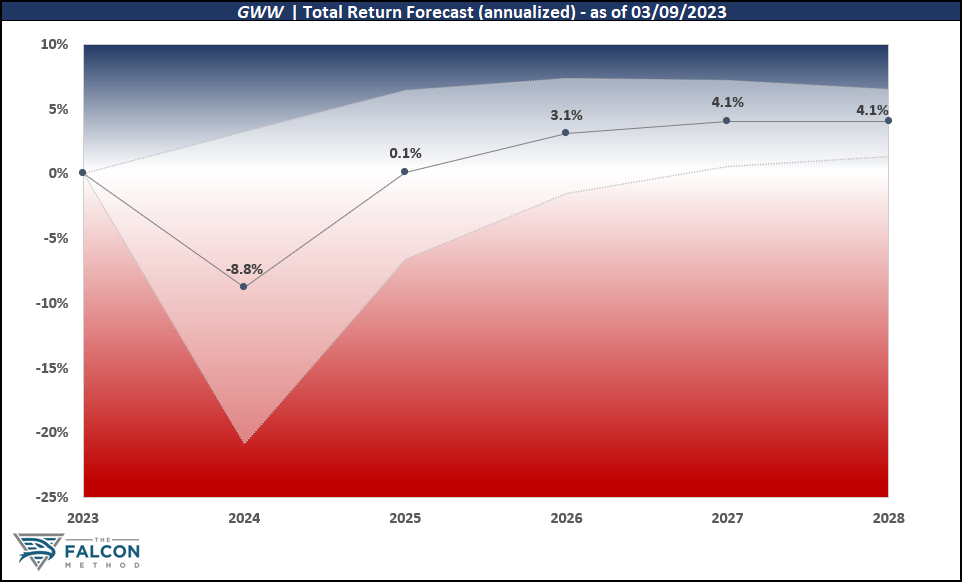
The annualized total return potential came in at ~4% over a five-year holding period when risk-free US Treasuries yielded above 4%!
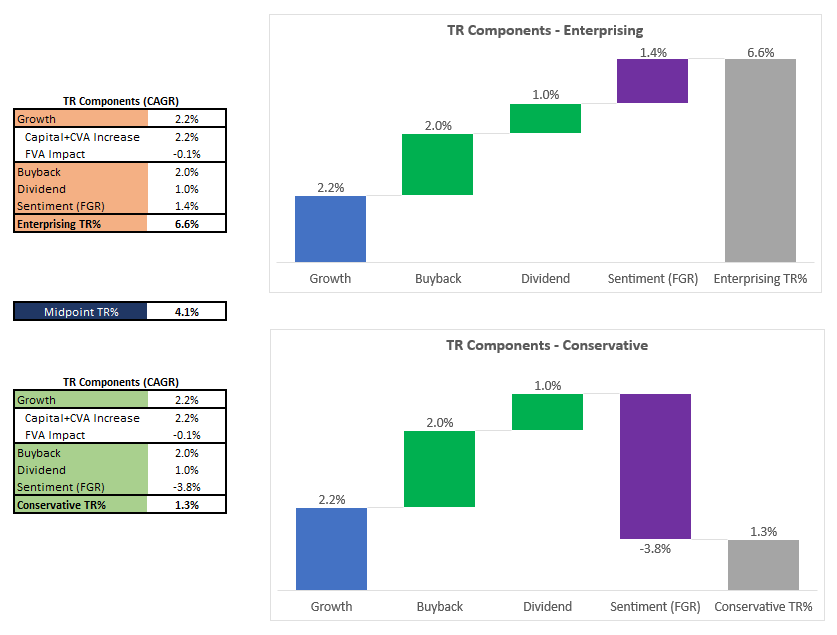
The waterfall charts of our two modeled scenarios show the composition of expected total returns. As you see, Grainger has a ~5% fundamental return potential, while the risk of a margin contraction (from the elevated levels) is far from non-existent. On top of this, the valuation may act as a severe headwind in our conservative scenario and would only slightly contribute to the total return potential in our enterprising scenario. The mid-point total return potential of 4.1% was simply too low to justify keeping GWW in our FALCON Portfolio.
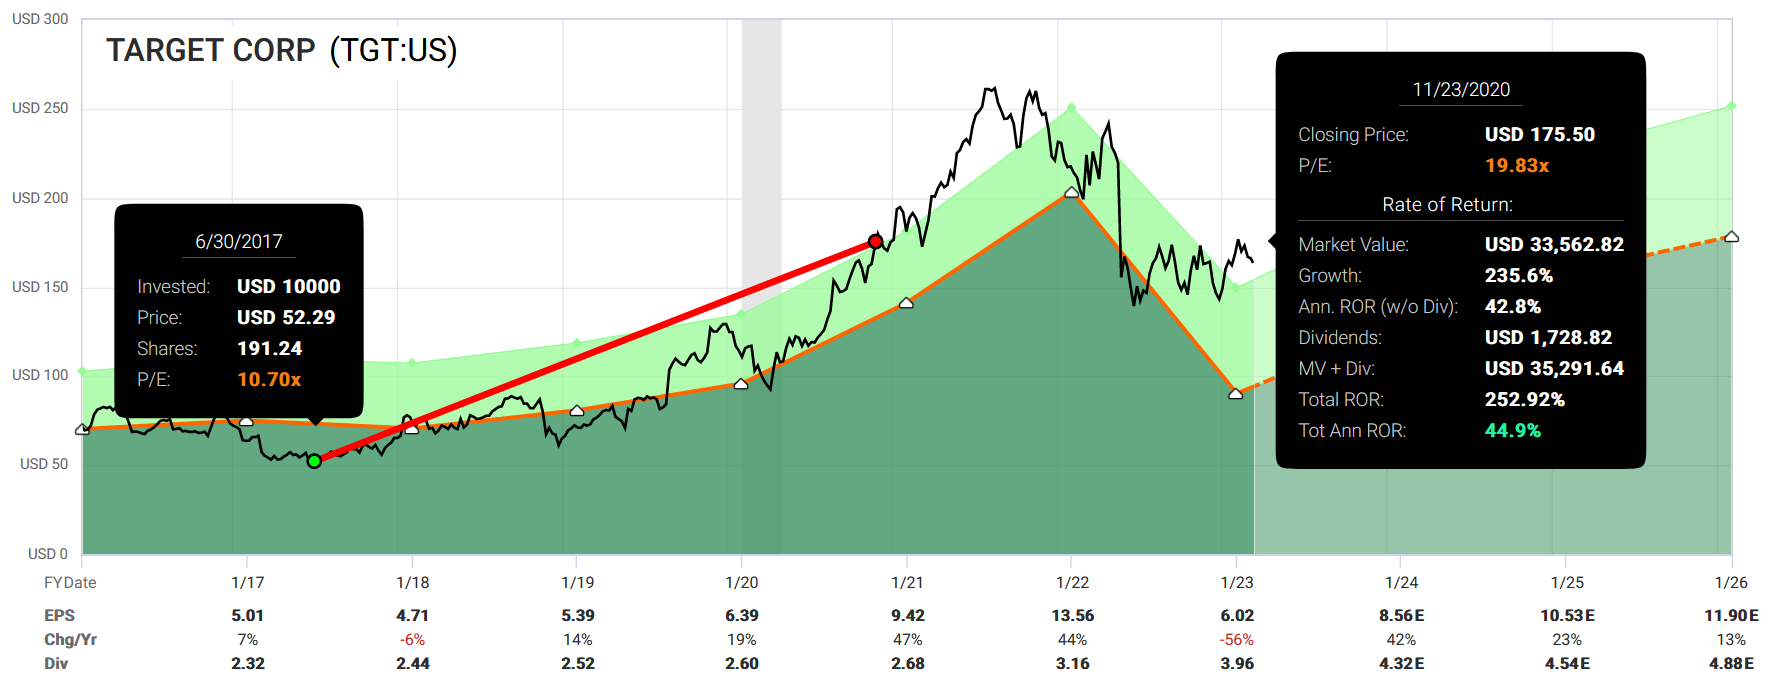
That said, the sentiment can always become more extreme before returning to normalcy. Just look at what happened after we sold Target (TGT) at $175 in November 2020, realizing a ~45% annualized return. The share price promptly shot up to $260 before coming back down to meet up with the fundamentals (or, shall I say, reality?).
Identifying the tops and bottoms is not the business the FALCON Method is involved in. Fortunately, that is not only impossible but also unnecessary for good investment returns. In fact, you can see from the summary table of our sold positions (as of March 2023) that the annualized return we earned with Grainger was not a one-off.
Courtesy of FAST Graphs, you can see how all three components of the total return formula worked in our favor with our Grainger investment.
- Earnings grew threefold (and EVA increased even more, as you could see),
- we pocketed growing dividends,
- and the valuation multiple also expanded (i.e., the sentiment got better after Mr. Market realized that Amazon didn’t kill Grainger, but the challenge posed made it a better company).
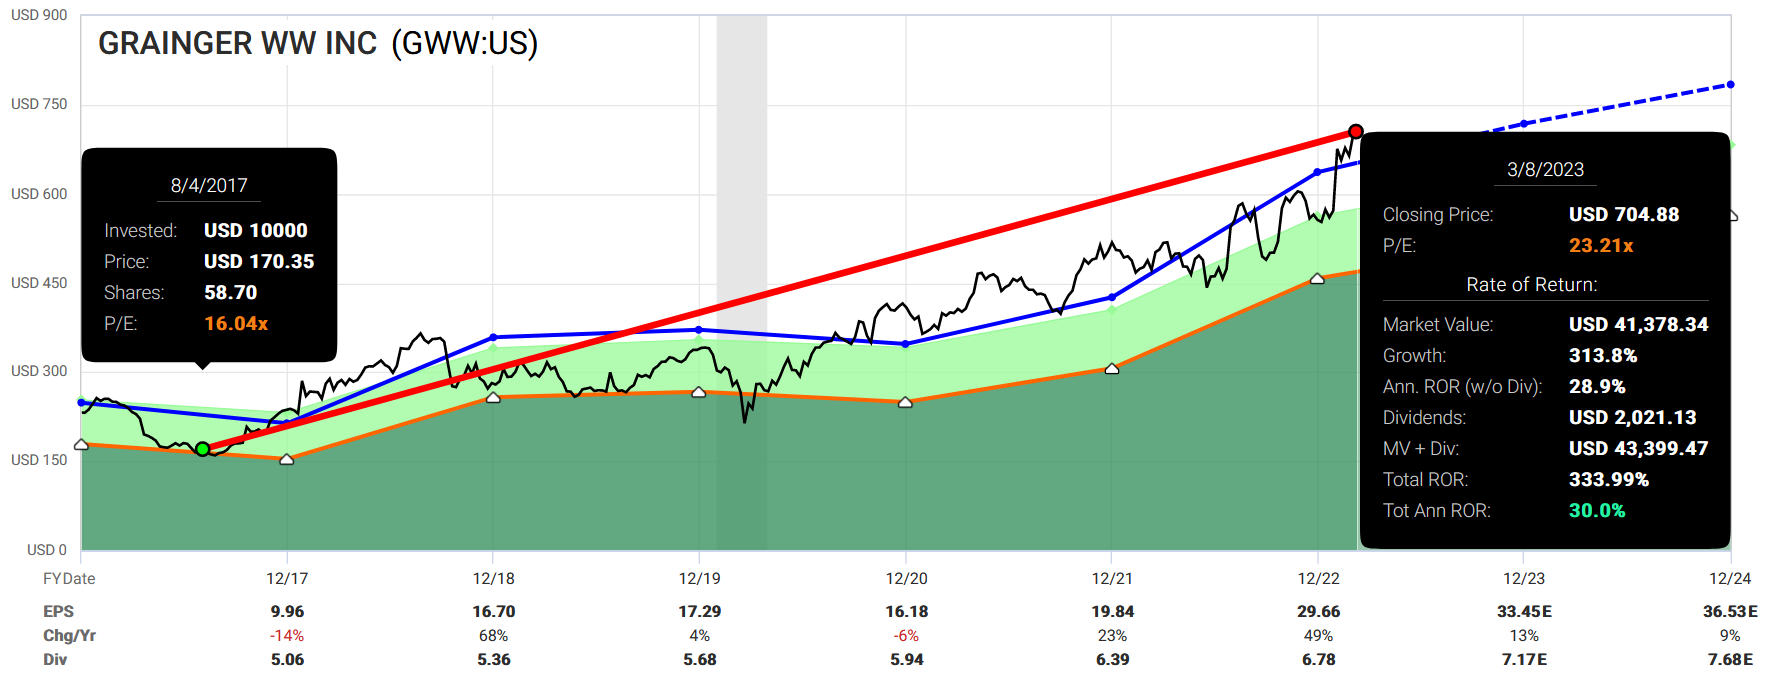
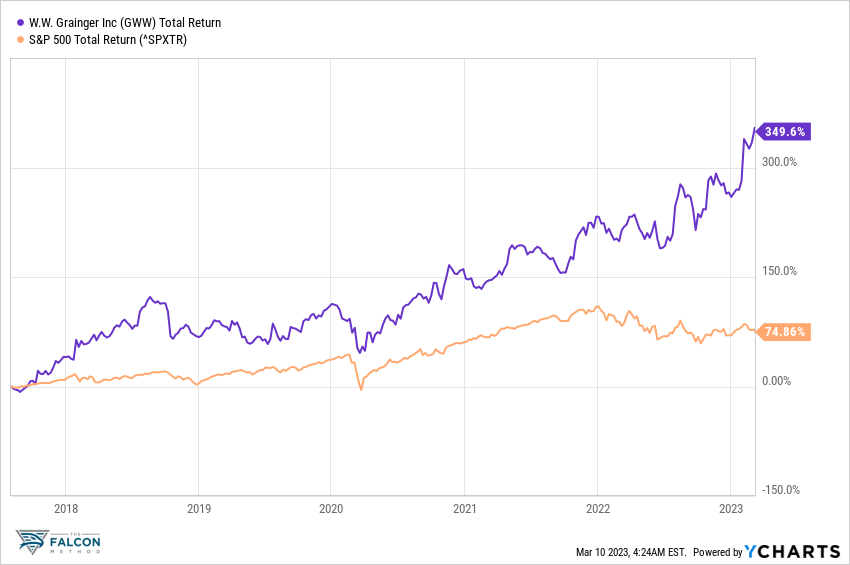
As a result of all the above, we could generate a market-beating total return with this Fallen Angel of better-than-average quality.
If you liked this piece, you can learn more about the FALCON Method by taking a look at this free report.
