Is That Stock Attractively Valued? Your Beloved Multiples May Fool You

The core principle of value investing is almost 100 years old, yet it is totally unchanged: always invest with a margin of safety.

This means that the stock you are buying must be priced at a huge discount to the underlying company’s intrinsic value. The part of the concept that is constantly changing is how you come up with the intrinsic value of the business.

Today most investors use the income statement and the balance sheet to calculate the value of the business. Common multiples are easily accessible on different websites that give the impression of thoughtful analysis and comparison of companies.

But the truth is that since the income statement and the balance sheet are both flawed from an investor’s perspective, these multiples are misleading and dangerous.

Serious stock investors should STOP using these multiples and focus on the business’s true profitability. (That is not presented in the accounting reports.)

In this article, we will go through the most common valuation multiples to bust them one by one. And at the end, we give you a link to learn more about valuing companies based on their true value creation. Long-term focused investors should focus on that instead.

Let’s start…

One of the first multiples: P/BV

Back in Ben Graham’s time (who is often referred to as the father of value investing), just after a depression, a company’s intrinsic value was defined as its liquidation value. Investors used the balance sheet to carry out conservative calculations to determine what shareholders would get if all the assets were sold and all liabilities were paid.

This is how they did it: Net Current Asset Value (NCAV) equals the company’s current assets minus its total liabilities (including preferred stock). Once you divide this NCAV by the number of shares outstanding, you’ll have a pretty good idea of what dollar amount a share may be worth if the business were to be liquidated.

Paying a much lower price than this was an approach that worked like a charm for over 40 years since stock prices were generally quite tightly tied to book values, and patient investors could often find companies that were out of favor, trading below estimated liquidation value.

As Bill Nygren, portfolio manager at The Oakmark Funds points out, “It was an asset-heavy economy, which made it appropriate to value businesses based on their tangible assets. In fact, as recently as 1975, 83% of the stock market value of the average company was represented by its tangible book value.”

Okay, now fast forward to today…

A lot has changed since then. Today you’ll see a much more asset-light economy, where intangible assets (like brand names and patents) account for over 80% of the average company’s market value.

(Just think about the industrial era when factories equipped with heavy machinery appeared on the balance sheet, compared to the intangible value of brands and software algorithms that is “invisible” to investors today.)

As Nygren puts it, “The linkage between book value and business value has been broken because so many important assets today are intangibles and don’t even show up on the balance sheet. […] For companies in the S&P 500 today, the correlation between stock price and tangible book value has become quite small, just 14%. This is a very big change from 25 years ago when that correlation was 71%—or 5x stronger than it is now.”

Here’s what Warren Buffett had to say about this shift: “My own thinking has changed drastically from 35 years ago when I was taught to favor tangible assets and to shun businesses whose value depended largely on economic goodwill.” Times are changing, don’t fall behind!

Here’s a sure bet: In hindsight, you must agree that buying Amazon’s stock at $600 around January 2016 would have been a great idea.

The thing is that the P/BV multiple of ~26 would have suggested otherwise.

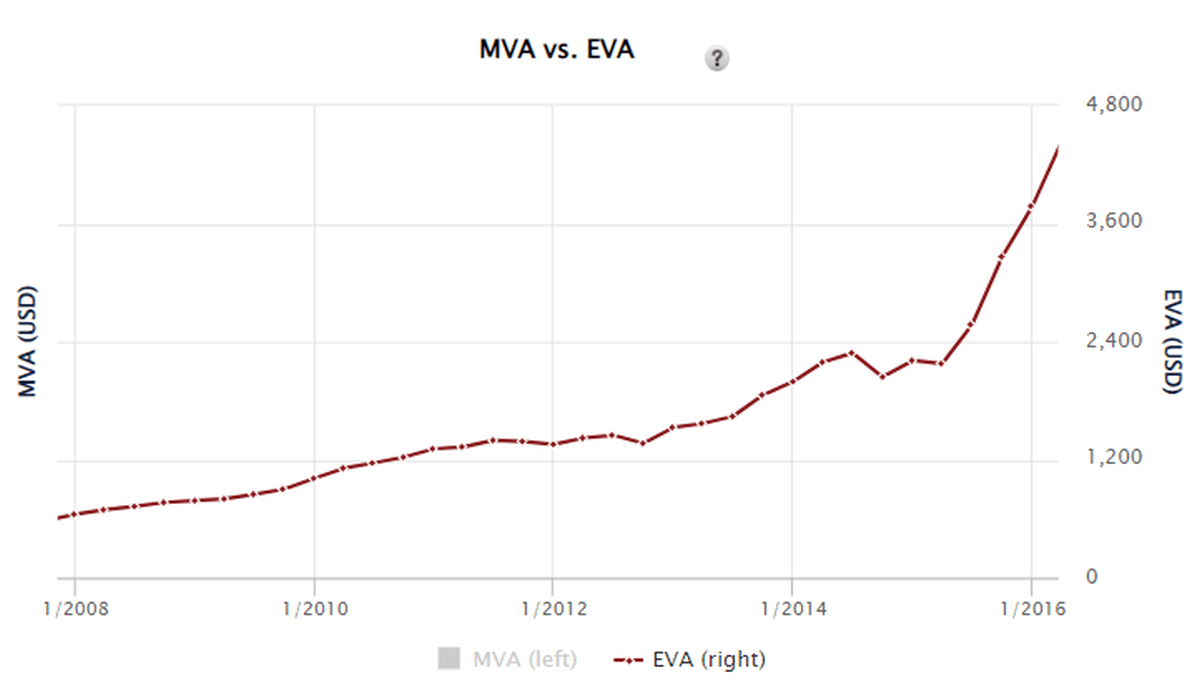
That valuation metric was crying SELL at that time, while Amazon was creating shareholder value on a formidable scale. (I’ll show more on this later.) P/BV clearly doesn’t have much to offer in the modern economy, period.

Accounting is not for investors

It is no surprise that most investors have turned to the earnings power of the companies to determine their intrinsic value. Too bad the income statement fails them just like the balance sheet did!

The problem is that the income statement no longer provides a reliable indication of the value a company created in a particular year.

Accounting and reporting are not meant to help investors but for calculating taxes.

But calculating the proper earnings to pay tax is not what we are interested in since we would like to get a true picture of the company’s operations and future potential

GAAP (Generally Accepted Accounting Principles) fails miserably when it comes to treating different forms of investments.

For example, when a company builds a new factory to scale up its production and sales, money spent on the construction is not immediately reported on the income statement; instead, the new factory appears as an asset on the balance sheet, and the money spent is deducted over several years as a depreciation expense.

You might say: Standard practice, isn’t it?

Okay, but what happens if the company spends that same amount of money on R&D to come up with a new product, which could strengthen its competitive position for years to come?

GAAP accounting treats this R&D investment as an expense, which needs to appear on the income statement in full and thus pull down the current year’s earnings. If you think like a business owner, you must admit that spending on R&D and building a factory are both investments that will serve the company in the coming years or even decades, yet GAAP accounting creates distortion by treating them differently.

Or think about increased brand advertising as an example that would result in understated earnings. Under GAAP, intangible growth-producing activities are immediately expensed. For example, money spent on research and development or advertising, which pays off over time, is written off in the year incurred. Investors need to tackle such distortions.

To make matters worse, GAAP offers flexibility in deciding whether certain operating costs are capitalized or expensed. 

Capitalizing the costs means that those costs will not appear in the income statement and thus will not drag down the earnings of the current period.

Instead, they will show up on the asset side of the balance sheet under some fancy name and will be amortized over time.

AOL made the most of this when they capitalized their direct-response advertising costs (that were part of their normal operations) in order to overstate earnings. To add insult to injury, once that fictitious asset grew so big on the balance sheet that even its amortization expense was hurting the manipulated earnings too much, management decided to double the amortization period of these exploding marketing costs meaning that they essentially cut the annual drag on earnings in half.

This simple accounting adjustment helped hide AOL’s huge losses from investors. 

Whoever still makes investment decisions based on reported earnings numbers can easily fall victim to the “garbage in, garbage out” syndrome. You can be smart, but if your input data is of poor quality, your decisions will also be far from well-founded.

Let’s see what could go WRONG…

First, which multiple would you pick?

Is the most popular price-to-earnings (P/E) your multiple of choice with EPS in the denominator? 

If so, you must be rooting for an increase in the company’s earnings-per-share so that this higher EPS, multiplied by your target PE ratio (that you wish the stock would climb back to), would give a higher share price, thus a higher return on your investment.

The problem is that EPS is the earnings that accountants calculate, and accounting has serious flaws. Accounting essentially treats shareholders’ equity as a free form of capital with no required rate of return (unlike debt, on which the firm has to pay interest).

I have yet to meet a shareholder who wants no return on their investment; still, their equity contribution is treated as free money according to the Generally Accepted Accounting Principles.

In fact, EPS can increase if all earnings are retained and simply invested at a non-zero rate.

Let me show you an example of this:

Assuming a company has earnings of $100 from operations in year 1 and retains all its earnings just to invest in a bond with a 5% annual interest rate, the company is doing better and better from an accounting standpoint. The earnings per share (EPS) increase, and the P/E decrease, signaling a better buying opportunity.

But does this make the company more valuable? Are you really satisfied with any non-zero return on that retained money that belongs to you?

From the investors’ perspective, it would be better just to pay out the earnings as dividends so that they could invest the money in other stocks, at least for the average stock market return of ~8%. Not doing so is a destruction of shareholders’ value!

To take this further, any investment financed with debt, such as a major acquisition, will contribute to accounting net income, increase earnings per share (EPS), and elevate the firm’s reported return on equity (ROE) so long as it generates a rate of return that is anything over the after-tax cost of the borrowed funds, that can be near zero these days.

Even Warren Buffett made this point in his 2017 letter to Berkshire shareholders: 

“The ample availability of extraordinarily cheap debt in 2017 further fueled purchase activity. After all, even a high-priced deal will usually boost per-share earnings if it is debt-financed. At Berkshire, in contrast, we evaluate acquisitions on an all-equity basis.”

Any firm can show positive net income and EPS along with EPS growth as long as it is covering the after-tax cost of the money it borrows. In accounting, stockholders’ equity is considered free.

As long as you have any return expectation when you invest in stocks, you must disagree with the Generally Accepted Accounting Principles (GAAP), and you most certainly need to address this issue when making investment decisions.

EPS says nothing about the true value creation of companies; thus, any multiple based on EPS should be used very carefully, if at all.

What about sales?

The biggest advantage of the commonly used P/S (price to sales) metric is its simplicity. Too bad the pros end here…

One of the downsides of the P/S ratio is that it doesn’t take into account whether the company makes any earnings or whether it will ever make earnings. Profitability makes all the difference! Consider a firm that loses money on every sale… Would you be happy with a high sales number, thus a seemingly cheap P/S multiple? Not really!

A dollar of sales at a highly profitable firm is worth more than a dollar of sales for a company with a narrower profit margin. Thus, the P/S ratio is generally useful only when comparing firms within an industry or industries with similar profitability levels, or when looking at a single firm over time.

In short: price to sales is not your reliable guide when assessing a stock’s valuation.

…but we still have cash flow!

“Earnings can lie, but cash flow cannot,” you may say. Unfortunately, I’ve seen too much to agree. While turning our attention to the cash-generating capability of the business is a great way to tackle most of the accounting distortions or outright manipulation, you have to accept that even the cash flow numbers can be fudged. Let me show you how!

Managers know that sensible investors are trying to estimate the sustainable level of cash flow that the company can produce, as only this can be the basis of a sound valuation. The cash flow statement is made up of three parts: operating, investing, and financing sections.

Of these three, cash flow from operating activities is the only one that is deemed sustainable since, unlike the cash provided by investing or financing activities, operating cash flow comes from a renewable source, operations.

It’s no surprise that managers want to classify as much of the cash flow as operating as legally possible, even if that classification may not match the economic realities of the business.

Again, GAAP provides ample room for playing with certain items. (You can find dozens of tricks in the book Creative Cash Flow Reporting by Charles W. Mulford.)

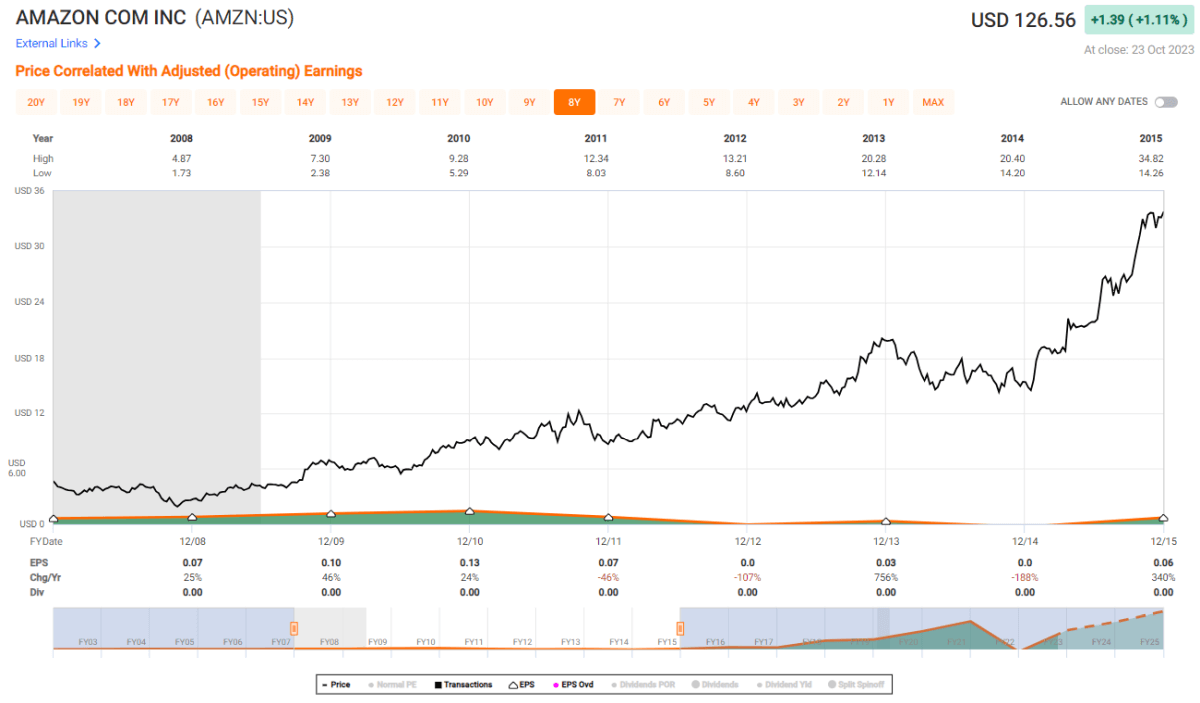
Looking at Amazon’s free cash flow (that is, operating cash flow minus capital expenditure) still doesn’t seem to explain the continuous upward momentum of the stock price. Looking at the green area showing free cash flow, all you see is bumpiness while the stock price was relentlessly moving up.

We need a much better explanation, a much closer relationship with the stock’s performance. Cash flow is just not good enough!

If cash is king… what about a free cash flow multiple?

Free Cash Flow (FCF) can be calculated by deducting capital expenditures from the operating cash flow. Basically, FCF is the amount of cash that remains after everything has been paid, all new investments have been made, and is available for distribution to the shareholders. The key question goes: Is more free cash flow always better? Not really!

A large amount of free cash flow may indicate that the company can’t find sufficient opportunities for new investments, which can limit future growth prospects. Negative free cash flow, on the other hand, could indicate that the company has an abundance of investment opportunities but not enough internal cash flow to pursue all of them.

In fact, FCF in any one year, or even over longer intervals, is not a reliable measure of performance. You saw this in Amazon’s example, right?

The key question is whether the company is investing in positive NPV (Net Present Value) projects that have attractive returns above the cost of capital. If yes, the more investments it makes, and the lower or more negative its free cash flow goes, the greater value is created (that will be reflected in the stock price).

It is simply not possible to tell whether a firm is more or less valuable by generating more or less free cash over a period of time, so there go the P/FCF and EV/FCF multiples out of the window.

That said, when I studied at Columbia Business School’s Value Investing and Advanced Value Investing courses, they advocated using EV/FCF and EV/EBIT as valuation multiples. Knowing what I know now, I’m not that fond of either. I’ll show you in a minute what my preferred metrics are and how I use them.

If you wish to devote some time to killing all the popular multiples containing EBIT, EBITDA, or book value, you may want to read the book Best-Practice EVA by Bennett Stewart. Not an easy read, but you can find examples there that illustrate how continuing growth in sales, EPS, EBIT, and EBITDA can be produced without any increase in shareholder wealth.

Even the PRICE is flawed

That said, the price (P) part of the ratio has its flaws as well. See Joel Greenblatt’s example below (from his book The Little Book That Still Beats the Market):

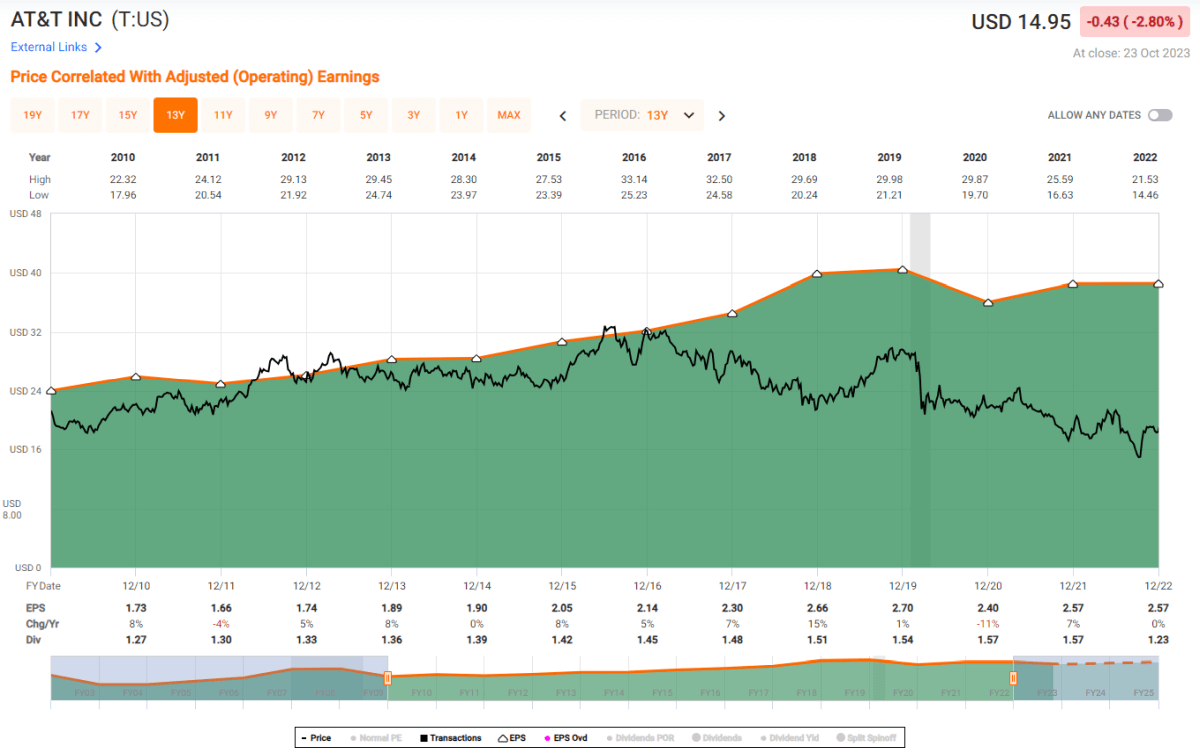
While A and B are the exact same companies, the difference in their capital structures distorts the PE (and all capitalization-based multiples, for that matter). Have you ever thought about this when mechanically applying your PE targets in a tool like FAST Graphs?

Sure, multiples using Enterprise Value (EV) instead of price address this problem, but as soon as you pick EBIT, EBITDA, or Free Cash Flow as the second part of your EV-based ratio, you may be in for some trouble.

As for EBITDA, Warren Buffett likes to say: “Does management think the tooth fairy pays for capital expenditures?” Excluding the necessary capital expenditures from any profit category (and valuation multiple) is a deadly mistake, and this is precisely what EBITDA does.

You may think EBIT could come to the rescue since it doesn’t exclude the depreciation and amortization part. True, but this earnings category is still derived from the profit & loss statement that is plagued by tons of accounting distortions.

With Free Cash Flow (FCF), as we mentioned earlier, our biggest issue is that greater FCF is not always better, as it can simply mean that the firm has no profitable reinvestment opportunities to pursue. Simply put, you cannot tell by a company’s FCF performance whether it is a good or bad business; consequently, you cannot use the FCF yield or EV/FCF metric to assess the valuation.

Warning: Not All Growth is Equal…

Many investors are fixated on growth (mostly EPS growth), and few take the time to contemplate that:

Not all growth creates shareholder value!

What I learned at Columbia Business School, the cradle of value investing (where Warren Buffett himself studied), was in perfect sync with what the EVA guys were saying.

Completing Columbia’s Value Investing and Advanced Value Investing courses taught me that the only type of growth that creates real value is where the incremental invested capital produces a higher return than the true cost of that capital.

EPS growth is easy to fabricate and is thus 100% meaningless! Remember the previous example of the company that invested in bonds at 5% interest and thus achieved earnings growth!

Or imagine a company that already has an extensive store network and great coverage in the country. Since management’s goal is to show growth, the retained earnings are not paid out as dividends but are used to open even more stores.

However, the returns for these new units are subpar (not as good as the previous ones), since the best locations are already taken.

Let’s say the company only achieves a 6% return on these new stores. Revenue and profit increase, and so growth is achieved. Well done?! 

However, the shareholders are worse off because the return on this newly invested money is less than what they could have earned by investing in the market themselves. This is a typical example of how focusing on earnings growth can lead management and investors astray.

The company created no real value, and shareholders shouldn’t be too happy with such a management team, but GAAP accounting provides reasons to celebrate for the ignorant investors. You should definitely break out of that category!

Do not follow the herd: Most valuation multiples are plain wrong!

Listen closely because this can be a game changer for you.

Everything you have just read comes down to a very important finding: the most widely-used valuation multiples can fool you (and other investors).

You’re not alone; most investors use multiples when it comes to assessing a stock’s valuation.

Your key takeaway is this:

The relevant metrics of business valuation may have evolved as decades went by, but as Berkshire Hathaway’s vice chairman Charlie Munger told at the company’s 2007 annual meeting:

“There is no one easy method that could be simply mechanically applied by, say, a computer and make anybody who could punch the buttons rich. By definition, [investing] is going to be a game which you play with multiple techniques and multiple models, and a lot of experience is very helpful.”

I couldn’t agree more.

Sensible stock investing is way too complex to qualify as a hobby or a part-time job. This is a profession!

At the FALCON Method, we are not “playing the stock market” but make thoughtful investment decisions supported by our evidence-based stock selection process. The difference between the two approaches is night and day!

Want to learn more?

This is how we value companies, based on their TRUE PROFIT metric, instead of the common multiples.

The FALCON Method newsletter service is there to support your investment decisions for a fraction of the fee we pay for the institutional-level data, so you get the work of our experienced analyst team as a bonus.

Ready to take the guesswork out of investing and get to the next level?

Learn more about how the FALCON Team uses these data to find the best stocks, or join our webinar on stock investing for free.

What is EVA and How to Find Attractive Stocks in Today’s Market?

To understand this piece of content, you must be familiar with the most important problems of the income statement and the balance sheet.

You have to accept the fact that accounting is not meant to help investors but to calculate taxes. Therefore accounting numbers are easily manipulated, and any multiple based on these reports is misleading and dangerous.

We have a whole article about proving these points; please, if you haven’t already, read it here:

Is That Stock Attractively Valued? Your Beloved Multiples May Fool You

Just to recap things:

  1. Accounting treats shareholders’ equity as free money (distorts earnings)
  2. Accounting treats two identical investment decisions differently (distorts earnings)
  3. Accounting provides ample room for management to play with certain items (distorts cash flow)
  4. P/E, P/FCF, P/EBITDA, P/BV, ROI, and ROIC are also badly distorted, thus not suitable to base serious investment decisions on them
  5. Even the PRICE component in the commonly used multiples leads to distortions because of differences in capital structures (distorts all multiples using the P component)
  6. Earnings growth can be high and still lead to shareholder value destruction (Not all growth is good)

We have a lot of data from accounting that we can use, but NOT in the raw form accountants and quarterly reports show them.

As Warren Buffett wrote to Berkshire shareholders:

 “Managers and investors alike must understand that accounting numbers are the beginning, not the end, of business valuation.”

The financial statements you can readily access should only be the starting point of your business analysis. Thoughtful investors have a lot of work to remedy these serious accounting distortions.

This is also crucial because today, with all the data at our fingertips, everyone is using the same multiples from the same websites, so it has become almost impossible to find an edge when valuing companies.

But those investors who can remedy these distortions and therefore come up with better fair value estimates are gaining an enormous advantage.

Let’s see how…

Where the TRUE profits are made

Since I put down my managing director position and sold my firm, I kept devouring books to explore every possible evidence-based way of wealth building and to get better and more confident investing my money.

After reading hundreds and hundreds of books on investing, in 2018, I came across a life-changing book while traveling to compete at IRONMAN Barcelona.

It was Best‑Practice EVA by Bennett Stewart and was so hard to read that I literally suffered through the 300 pages. 

Still, it felt obvious that Stewart’s message about EVA (Economic Value Added), which is the true profit a business makes after several adjustments to its misleading financial statements, makes a ton of sense. 

The main goal of EVA is to show you whether a company is creating value by earning more than its true cost of capital or not. (Surprisingly, about half of the publicly traded companies belong to the latter group.)

In the quest to discover this, addressing all the distortions of GAAP accounting one by one is inevitable. The EVA framework does just that.

EVA is the real value the company created in a particular year after addressing all accounting distortions. It’s not an accounting term, and you won’t find it on the income statement or the quarterly reports.

This is a TRUE PROFIT METRIC we have to calculate. To get to this true profit number, we do not have to start from scratch; that would be way too impractical and too much work. But we have to make the necessary corrective adjustments to arrive at the real economic profit of a business.

How to get to the EVA?

In simple terms, EVA is a metric that measures the firm’s profit remaining after:

  1. Deducting all costs adjusted for accounting distortions one by one
  2. Including the cost of giving the firm’s investors a full, fair, and competitive return on their investment in the business.

EVA is a comprehensive net profit score that charges for all capital used, including shareholders’ equity, which is falsely considered free money under GAAP accounting.

EVA is far superior to EPS or Free Cash Flow; in fact, charging for all capital makes EVA the most demanding profit performance measure and the number one choice for investors with a long-term business owner mentality.

Let me emphasize this again: EVA is very strict and sets the bar as high as possible.

Although Warren Buffett has never used the trademarked term EVA (Economic Value Added) in his letters, he keeps emphasizing the importance of the “money’s-not-free approach.”

EVA is sales less operating costs (adjusted for distortions) less the full cost of financing business assets as if the assets had been rented.

To be exact, there are at least 15 different accounting distortions that are corrected by the EVA framework. We already talked about the capital being free and the R&D investments.

But there are many more, like deferred taxes, managing leased assets, correcting impairment charges, operating reserves that need to be addressed, and many more nuances I do not want to cover here since it could fill a book alone. 

In fact, there is a book about it called Best Practice EVA. But if you are curious about the details now, you can look at our list of the 15 most important accounting distortions here.

Case study: How good is EVA?

In the EVA framework, the company is earning a positive economic profit only after covering all resource costs, something that is true of only about half of the public companies in the economy at any time.

(Read it again: it is not at all evident that companies are earning adequate returns on the capital they employ. More companies are profitable in the accounting sense than those who can outearn their true cost of capital, with the equity portion included.)

Take a look at Whirlpool between 2013 and 2019!

As you see, earnings per share shows a nice increase almost every year between 2013 and 2019 (from $10 to $16), yet the stock price (the black line) is moving sideways. EVA shows you the reason:

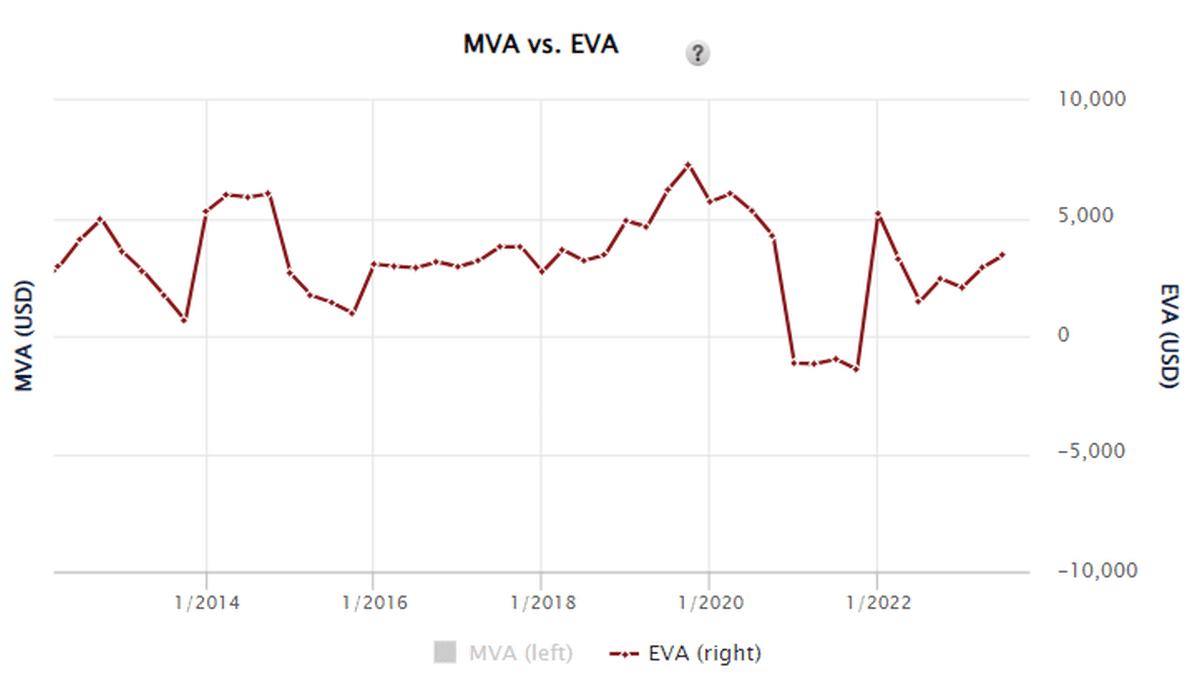
Wherever EVA goes, the share price follows. (It’s proved by statistical methods, just keep on reading…)

We can create an “EVA Income Statement,” which is similar to the traditional income statement but meant to serve investors. These numbers are adjusted for accounting distortions and thus show the real economic profit investors should focus on instead of the traditional “earnings” meant for accountants.

Let’s take a look at Whirlpool’s numbers, and discuss why the stock price did not move:

While EPS exhibited growth, the increase in EVA (real value creation) was not that clear, to say the least. This is a classic example of where EVA and EPS differ, and EVA wins the argument.

That said, I came across a white paper which revealed the true relationship between the EVA-based shareholder return predictions and the actual shareholder returns. (TSR stands for Total Shareholder Return in the chart below.)

The Link Between TSR and EVA

Source:  The Link Between TSR and EVA, Bennett Stewart

The results are MIND BLOWING. The graph shows how close the predictions to the actual returns were. You can see that the predictions were almost 100% percent spot-on!

Once more: EVA is the TRUE economic profit that the company makes in a given year. This is what long-term investors should focus on, and this has the best predictive ability among all the different metrics.

That said, we have data to compare different performance metrics in their predictive ability of MVA.

MVA is a very significant measure, more important than Total Shareholder Return in many ways. MVA indicates how much wealth a company has created for its owners by comparing the cash that investors have put or left in the business with the present value of the cash they can expect to take out of it. MVA also measures a firm’s franchise value.

Without going into the details now, you can see from this graph that EVA momentum (which is just change in EVA divided by sales) is the best predictor of a business’s value creation.

How Does the EVA Framework Measure Valuation?

When it comes to valuation, I tend to prefer a complex approach instead of going with one single multiple or metric.

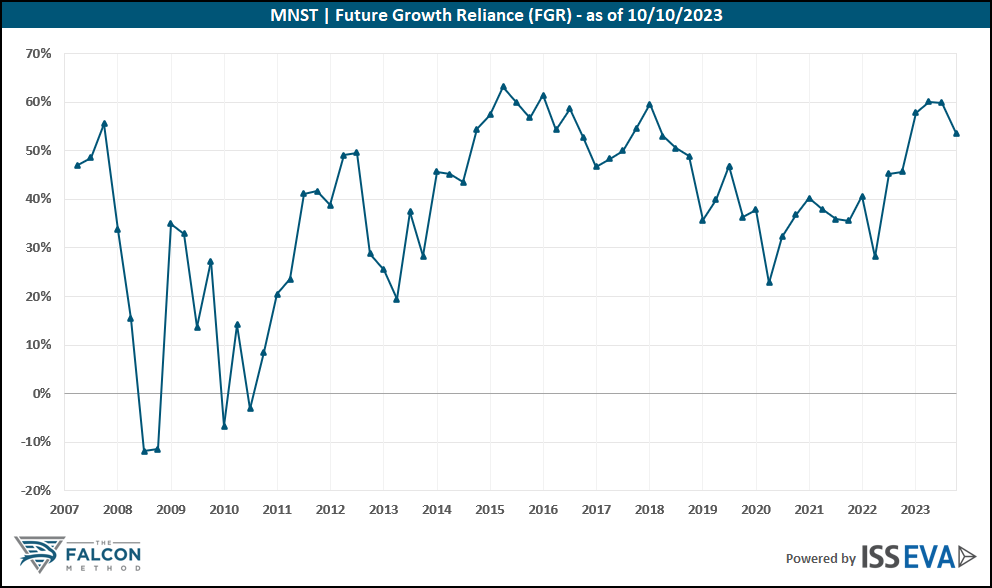
At the FALCON Method, we are using two distortion-free multiples (EV/EBITDAR and MV/NOPAT) and an EVA-based indicator (Future Growth Reliance) to assess a stock’s current valuation in historical comparison.

I am going to explain them one by one…

FGR: How much growth is priced in the shares?

As expectations about future value creation are a driver of the stock’s valuation, it’s time to dissect the components of value in the EVA framework so that we can see what expectations are reflected in the current stock prices.

Remember: EVA is the real value the business created for its investors. The more the EVA, the better the performance. In contrast to earnings or cash flow, EVA takes the distortions of GAAP accounting into account.

For quantifying the expectations for future growth in EVA, we can use the so-called Future Growth Reliance ratio. I deliberately simplify here just to get the point through as easily as possible.

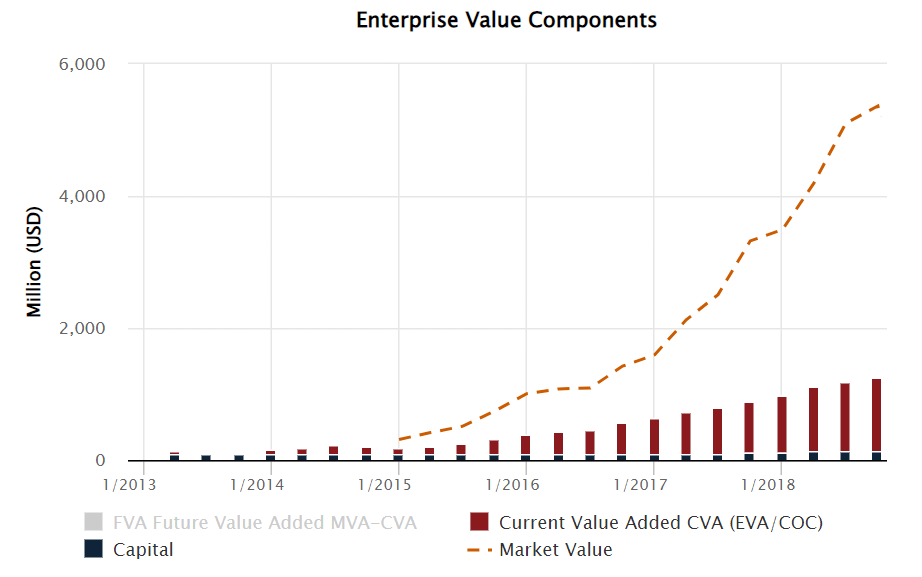
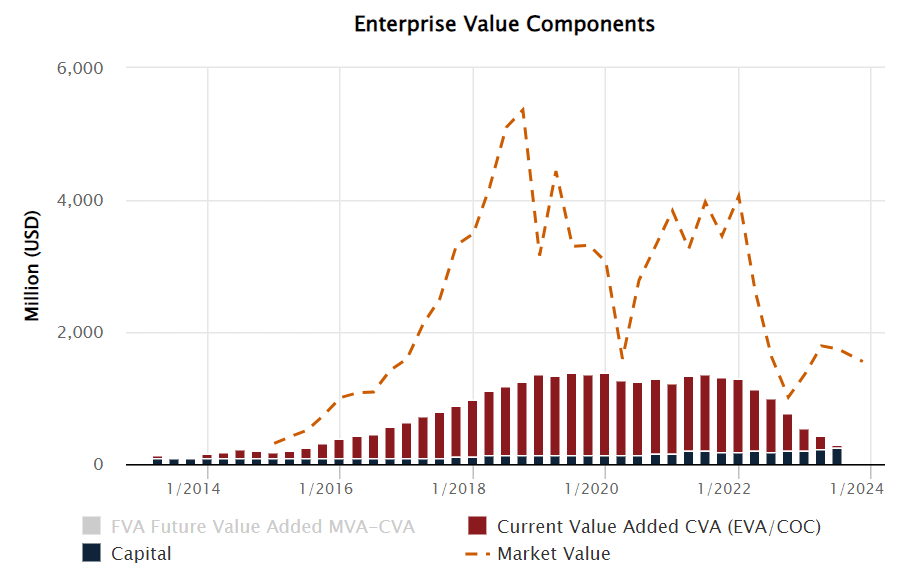
Below you can see how these components make up the Market Value and how we can get from this enterprise-level metric to the market cap.

A firm’s market value consists of the following components:

  • Capital: That includes all capital invested in the business, including working capital, net property, plant, and equipment, the present value of rents, intangible capital, and several capital adjustments.
  • Current Value Added (CVA): The value derived from capitalizing current level EVA at the cost of capital in perpetuity. In practice, this is trailing 4-quarter EVA divided by the cost of capital (i.e., a zero-growth EVA perpetuity). This comes from assuming that the firm’s EVA remains constant forever.
  • Future Value Added (FVA): The present value of the expected growth or decline in EVA. When a stock has negative FVA, investors expect EVA to decline from its current level and vice versa.
  • MVA stands for Market Value Added and is the sum of CVA and FVA. MVA essentially measures how much more the company is worth than the capital that has been put in.

There is a way to derive FVA from share prices. This means we can calculate the ratio of the firm’s market value that is derived from and depends on future growth. (Measured in EVA, of course.)

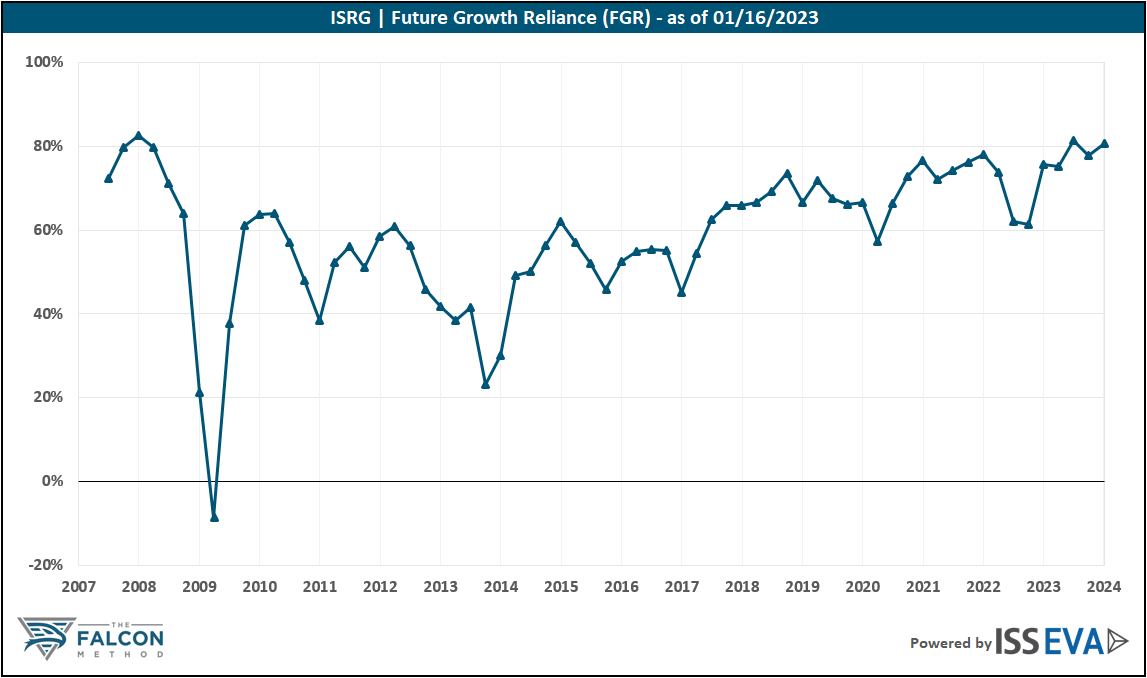
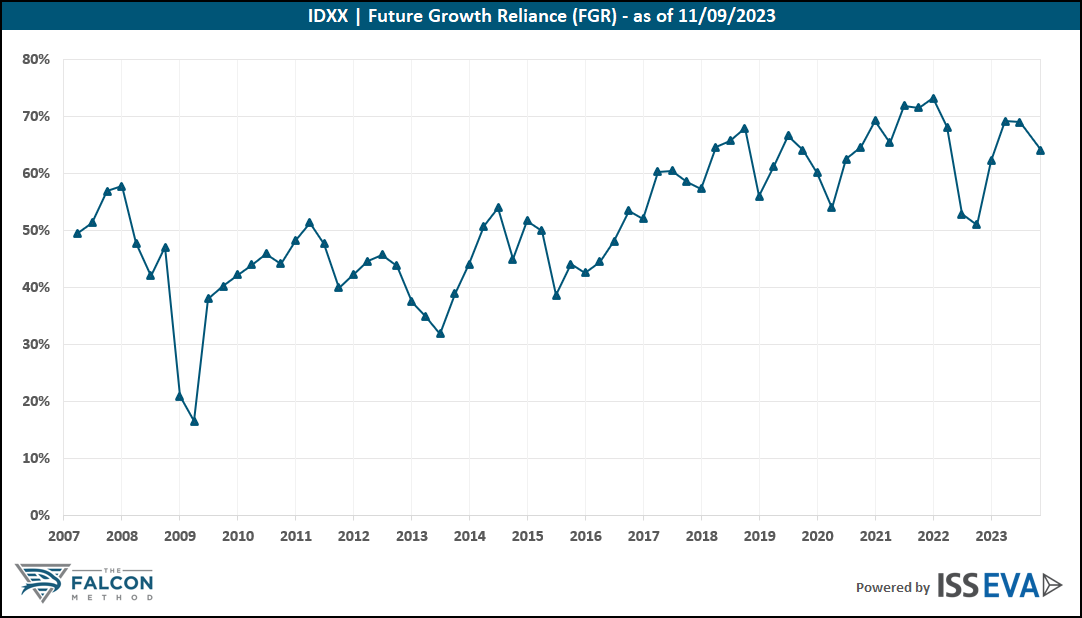
This percentage value is called the Future Growth Reliance (FGR), which is just the ratio of FVA to market value.

In other words, Future Growth Reliance is the percentage of the market value that comes from future expectations and is yet to be realized.

So basically, FGR shows how much of the stock’s current market value stems from the expectations about future EVA growth.

For example, the FGR ratio of 20% says that the firm’s market value would tumble by 20% if investors became convinced that it would never be able to increase EVA above its current level.

A negative FGR ratio signals that the market is discounting the stock’s current level of EVA, indicating an expectation for future headwinds.

Let me put it this way: if the FGR equals -50%, but as an investor, you are convinced that the firm will be able to produce better results (higher EVA) than the current level, then you may have found an undervalued stock. (You shouldn’t pull the trigger just yet, but it’s a good sign.)

We mainly use the FGR for historical comparison, but this metric also comes in handy when setting the limits of the reasonable valuation range with our total return calculation.

To sum up, a higher FGR ratio indicates a higher valuation. We want to buy our top-quality stock targets when this sentiment indicator is low.

Here’s a short sample from the newsletter’s analysis on Tencent with the stock’s Future Growth Reliance presented below:

No matter how you look at it, the stock seemed to be attractively valued historically (at the time of publication) since the lower these metrics, the more pessimistic the valuation.

Two more valuation metrics

Since it’s always useful to inspect a company from more angles, besides Future Growth Reliance, we employ two other distortion-free multiples.

These are EV/EBITDAR and MV/NOPAT.

Numerators first…

EV and MV stand for enterprise value and market value, which are essentially the same, but the EVA guys are using two different labels for some reason.

EV or MV equals the value of the stock’s debt and equity capital, given its share price, net of excess cash, and assuming that the book value of liabilities approximates their market value.

Simply put, EV or MV equals: market cap + total debt – surplus cash.

We proved earlier that the “P” in multiples like P/E could be misleading when the company has any debt – which they usually do. By using EV or MV in our multiples instead of the PRICE, differences in capital structure will not distort our assessment.

So let’s see the denominators…

After corrective adjustments to remedy accounting distortions, NOPAT measures the free cash flow from operations that is distributable after ensuring that tangible and intangible assets needed to sustain the profit can be replenished.

EBITDAR is an improved version of the widely used EBITDA metric as it includes add-backs like rent expenses, R&D, and advertising spending.

Both the NOPAT and EBITDAR multiples are useful and highly-enhanced versions of the commonly used valuation multiples.

Two Eye-Opening Examples

The case of Zoom Video Communications (ZM) shows that it is easy to disappoint when essentially all the company’s value stems from future growth expectations.

On the other hand, Apple’s example shows that even wonderful companies can be bought at astonishingly attractive valuations.

The negative FGR means that the market was not only pricing in zero growth but even predicted value destruction. Investing $10K in Apple in June 2013 at the point of extreme pessimism would have netted you a ~12x result as of January 2022.

Using top-quality data pays off big time! Now let me show you something really interesting…

EVA for Everyone? Really?

I used to be a devoted dividend investor – I even wrote 2 books on the topic – but after discovering all the above, I started to pay more attention to the most important component of total return: EVA growth.

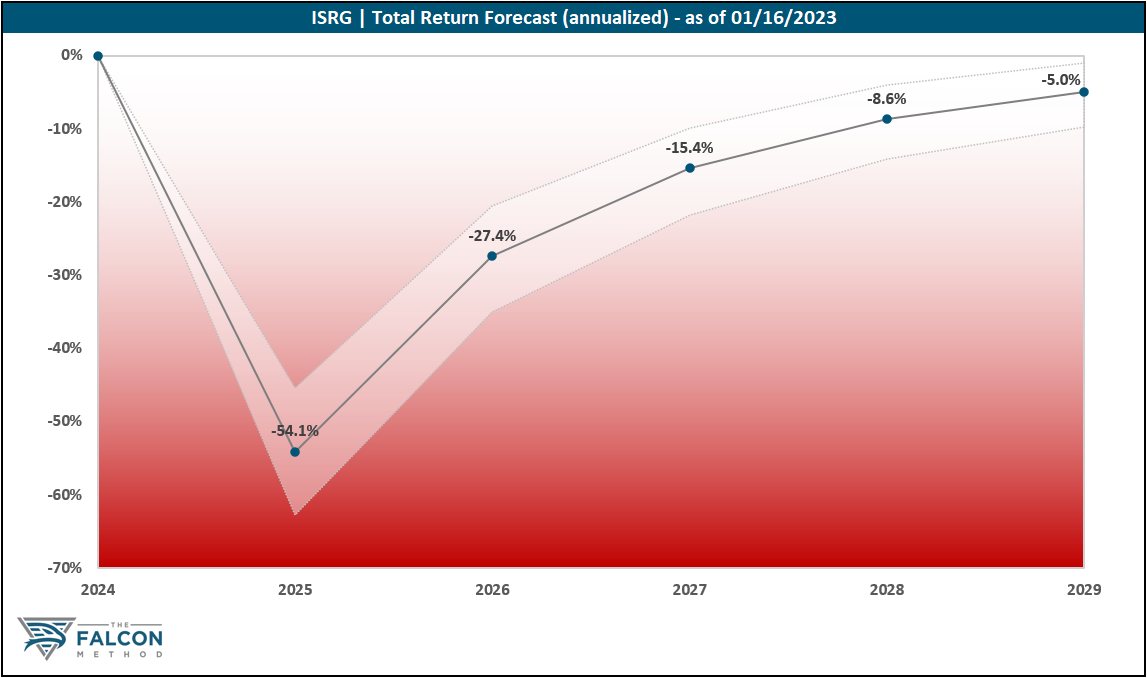
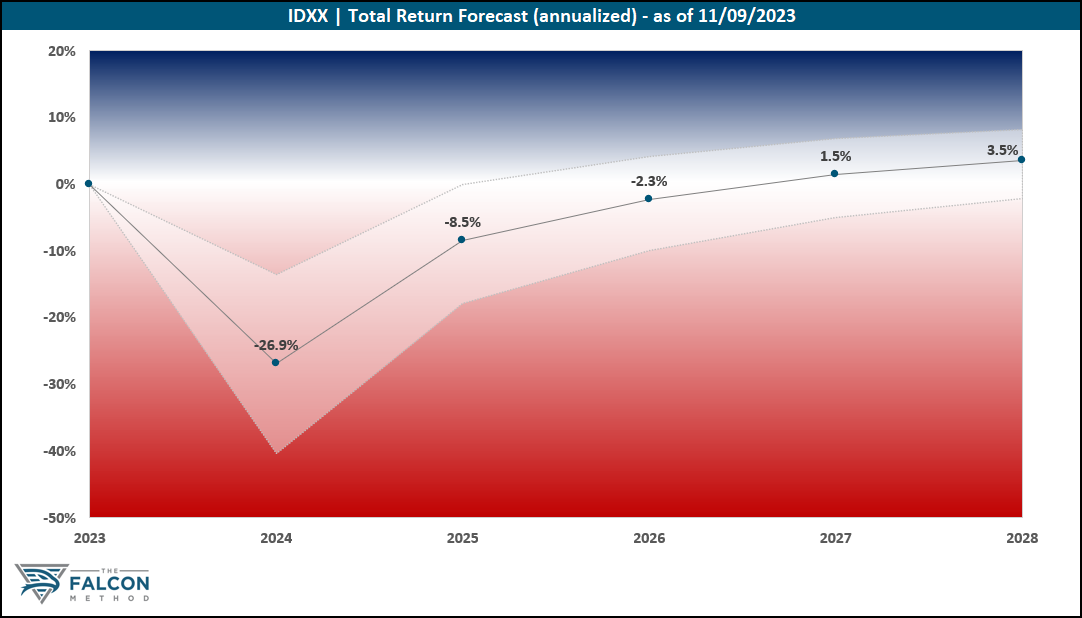
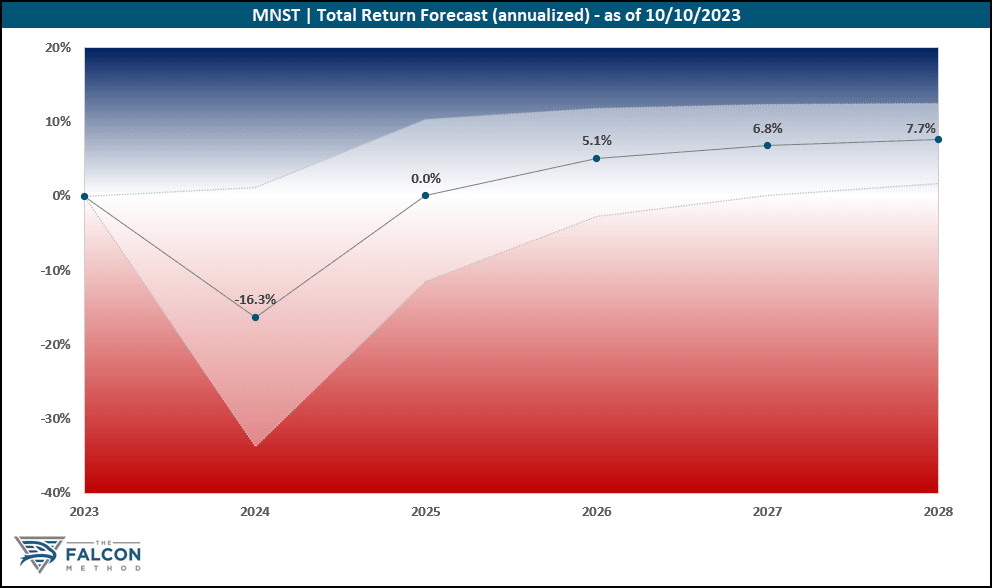
When compiling the FALCON Method newsletter’s list of Top 10 stocks, we are building EVA-based financial models to calculate a reasonable range for every stock’s annualized total return potential.

After reading the annual reports, earnings call transcripts, and watching management’s presentations; we feed our models with input data like analysts’ expectations on sales and margins, dividends, share buybacks, and historical valuation multiples.

We build both a conservative and an enterprising scenario to arrive at a range of results, as shown in the chart below.

Nobody knows the future, so thinking in ranges is the only sensible way to go. When you see numbers in the neighborhood of 20% while having a total return requirement of 12-15%, you know you have a significant cushion (a margin of safety) built in.

That said, we tend to be cautious when putting together the underlying models, so when the potential total return figures are this high after applying the margin of safety principle at every preceding step of the process, we know we are on to something promising.

We are looking for the best of the best quality companies (based on EVA metrics) with substantial projects to reinvest their earnings with high returns. This exceptionally good combination is rare but finding those pays off.

We call these companies EVA Monsters, and you can see their returns compared to some well-known indexes.

Falcon Method Vs market

Regardless of your investment style, I firmly believe that the EVA framework has something to offer you. 

For dividend investors, it may be worth taking notice that wherever EVA goes, the stock price follows; and it is also nice to earn great total returns while harvesting those reliable dividends.

See for yourself on the chart below.

Where EVA growth was lackluster, the share price went nowhere in the examined 5-year period, and dividend growth rates were also unimpressive.

On the other hand, dynamic EVA expansion entailed exceptional share price performance and dividend growth in the case of Domino’s and BlackRock. My preference is with EVA growers…

For hardcore value investors, EVA can help avoid value trap situations.

Investing in melting ice cubes that always look cheap all the way down to zero is the most costly mistake a value investor can make, and here comes EVA to the rescue, as shown in GameStop’s case study.

You can see that traditional, widely-used metrics like P/E showed that GME stock was cheap all the way down from $32 to $3.

Earnings per share was not there to guide your decision-making, while EVA acted as the canary in the coal mine and would have convinced you to steer clear of this value trap situation.

Last but not least, for growth investors, it comes in handy that EVA lets you separate the wheat from the chaff; thus, you can focus on the time-tested category of quality-growth stocks instead of buying all the speculative, cyclical “pure growth” names out there.

As the EVA concept highlights, only that type of growth creates shareholder value where the company earns a higher return on its growth projects than the true cost of the capital needed to finance those projects. All else classifies as value-destructive growth, and you’ll want to steer clear of those companies where management’s empire-building ambitions take priority over creating shareholder value.

I am ready to admit that after rereading the EVA book 5 or 6 times and diving deep into ISS’ institutional-level data, I wouldn’t make an investment decision without looking at the EVA metrics of the company I’m analyzing.

The only obstacle is that EVA data is probably too expensive for small investors.

Of course, there is a do-it-yourself way to calculate EVA, but as soon as you gain an in-depth understanding of all the accounting distortions and the accompanying remedies, you will most likely feel that it would take an unreasonable amount of your time.

I am grateful that the FALCON Method newsletter business made it possible for me to access the EVA database, evolve further, and take a giant step as an investor.

Thanks to this, anyone who subscribes to the Falcon Method Newsletter can profit from this data, which would otherwise be only available to those with exceptionally large capital.

With the help of the EVA data, I could repay my subscribers’ trust by taking the newsletter service to the next level, making 1000+ of them even more satisfied.

(We have a ~95% subscriber retention rate as I write this, which is considered exceptional in an industry with a standard rate between 70-80%.)

At the FALCON Method, we are using the EVA framework to identify the couple dozens of truly exceptional quality-growth companies worldwide (we call this category EVA Monsters, as shown on the chart above), and we are also continuously monitoring the market for reliable dividend payers with attractive total return potential (we call them Fallen Angels).

Our subscribers get the best of both worlds within the same service, so they can have their dividend income without compromising on total returns.

Makes sense? You can learn more about the FALCON Method here and see how you can make institutional-level decisions for a price that is affordable to individual investors.

Do you enjoy learning about investing? Then you will love our free webinar about EVA-based stock investing.

The 5 Steps of the FALCON Method

***UPDATE: As the FALCON Method kept evolving, this post got updated. You can read the latest version here.***

Identifying the quality stocks that are on sale can be easy if you have an evidence-based system to help you. The FALCON Method is an all-round investment process that relies on the principles of value investing, common sense, and quantitative discipline. The goal is to construct a buy and hold portfolio with a focus on both income and total return. All the steps are backed up by factual evidence as you’ll see below.

“If you can’t describe what you are doing as a process, you don’t know what you’re doing.” W. Edwards Deming

1: The Quality Criterion: Go for the true and tried!

Common sense idea: Only invest in top quality companies that have stood the test of time. These businesses have great internal economic fundamentals and long-term track records for performance and excellence.

 “Time is the friend of the wonderful company, the enemy of the mediocre.” Warren Buffett

As a long-term investor aiming for wealth building and reliable passive income, you should go for the wonderful companies instead of the mediocre ones.

Rule: Stocks must have at least a 20-year immaculate dividend history–meaning no dividend suspension or cut–to qualify. If a company has been able to pay growing dividends for decades, it’s a sure sign of its consistent earnings power. Taking this argument one step further, it is no surprise that companies with these characteristics tend to outperform.

“The importance of dividends in generating stock returns is not just historical happenstance. Dividends are the crucial link between corporate profits and stock values.” Jeremy Siegel

Evidence: The Dividend Aristocrats (stocks with 25+ years of rising dividends) have outperformed the S&P500 over the last 10 years by a considerable margin. (Source: us.spindices.com/indices/strategy/sp-500-dividend-aristocrats)

For further evidence read the book: The Future for Investors: Why the Tried and the True Triumph Over the Bold and the New by Jeremy J. Siegel

Here’s a short summary of the findings:

“We have also examined the 10 highest-yielding stocks among those that have not reduced their dividend in the last 15 years. A period of 15 years was chosen because that means the firm must have passed through at least one recession. Managements that have not cut their dividend have demonstrated the consistent earning power and strength of their corporations.” Prof. Siegel found that these group of stocks tends to outperform. This simple strategy had a 15.68% annual return between 1957 and 2003 vs. the 11.18% of the S&P 500.

We need a long dividend history so that we can test how the company’s management behaves when things get tough. Siegel uses a 15-year timeframe, while the FALCON Method goes for 20 years of immaculate dividend history. Notice also that the professor simply picked the highest yielding stocks from his select universe, while the FALCON Method uses a multi-faceted approach (the components of which are all proven).

2. The Value Criterion: Buy them on the cheap!

Common sense idea: Everyone loves bargain purchases. Buying top-quality stocks at low prices not only feels good but also leads to superior investment returns. Bargains are temporary as prices rise in the long-run (boosting our returns) to reflect the underlying quality of the businesses.

“Whether we’re talking about socks or stocks, I like buying quality merchandise when it is marked down.” Warren Buffett

Rule: Take a multi-dimensional look at valuation. Use indicators like Price-to-Adjusted Operating Earnings, Price-to-Operating Cash Flow, Price-to-Free Cash Flow, Price-to-EBITDA and examine their historical averages in multiple time frames. Compare the current valuation ratios to the historical averages and make sure that the current level reflects a fair or better price. If you buy top quality stocks at below-average valuation the powerful force of mean reversion is on your side. (Valuation ratios tend to move back toward the mean or average and this multiple expansion helps your investment returns.)

Evidence: Look at the performance stats of the S&P 500 Pure Value Index and the MSCI World Value Index and see that value investing outperforms in the long run.

We also have historical proof showing the outperformance of the individual factors used. When examining the tables below, please notice that the longer the holding period the higher the probability of outperformance is with all the factors.

Price-to-Earnings type of indicators:

An example, and your key to understanding these tables: If you pick 10-year holding periods from 1964 to 2009, the most attractively valued tenth of stocks (the Earnings/Price Decile 1) outperformed the market 99% of the time. The average annual excess return was 4.63%. All the tables below should be read in the same way.

Price-to-Cash Flow type of indicators:

There was not a single 10-year period in the sample when the most undervalued tenth of stocks (based on cash flow to price) did not outperform the market.

And the same is true for the EBITDA metric below.

Using these proven indicators to gauge valuation levels and going for the historically undervalued quality stocks tilts the odds of success in our favor.

3. The Threshold Criteria: Are you getting paid enough?

Common sense idea: For every dollar you invest you want to get the most possible money in return. Under a certain threshold, you are not that keen to invest your capital at all.

Rule: Compare the price you pay for a stock to the amount of Free Cash Flow the company produces per share (FCF yield), the money it returns to its shareholders through dividends and buybacks (shareholder yield), and the dividend it pays (dividend yield). Taking the prevailing market conditions into account, set absolute minimum requirements for these three and only consider a stock worthy of your money if it meets all these three criteria.

Evidence: The selection of the three indicators is logical since you demand that the company produces surplus cash, returns some of it to the shareholders, and makes dividends a considerable part of these returns. Besides being logical this selection is also evidence-based. See below, how all of these factors support outperformance.

Price-to-Cash Flows, again:

The shareholder yield as a strong factor:

For additional evidence on this metric read the book Your Complete Guide to Factor-Based Investing by Andrew L. Berkin and Larry E. Swedroe. The authors elaborate on how investing in the stocks providing the best shareholder yield has outperformed both the market and the simple dividend-yield strategy in three out of the past four decades.

The dividend yield also deserves a place in our system but it wouldn’t be enough on its own!

James P. O’Shaughnessy finds in his book What Works On Wall Street that the dividend yield becomes much more powerful as a factor if used with a select group of quality dividend paying stocks only (instead of all the stocks on the market). Exactly how the FALCON Method does it.

4. Yield Plus Growth: A multifactor ranking for maximizing total return

Common sense idea: All things being equal, the higher dividend and the higher dividend growth you get for your money, the better. Your total return is determined by three components: the starting dividend yield, the growth of the underlying company, and changes in the valuation multiple. (The latter has been taken care of in the second step of our process.)

Rule: Rank the stocks that survived the previous steps based on yield-plus-growth characteristics. Instead of using an oversimplified indicator like the popular Chowder number employ a weighted multifactor quantitative ranking with yield-plus-growth numbers of different time frames. The higher the yield-plus-growth rank, the better.

Evidence: Stocks of companies that keep growing their dividends tend to outperform. (Source: Oppenheimer)

Additional evidence about the relevance of dividend yield and growth:

Why Dividends Matter (Guinness Atkinson Funds)

Reasons to Consider Dividend-Paying Stocks (Dreyfus)

Dividends for the long term (J.P. Morgan Asset Management)

5. Sleep Well At Night: The finishing touches

Common sense idea: No matter how good a stock looks in a ranking system if you don’t feel comfortable investing in it you will have a hard time holding on when panic erupts. Only buy stocks that you intend to hold for the long-run.

At this point, rules have already played their part and human judgment comes into play. No matter how much one prefers quantitative methods some things simply cannot be quantified, filtered, and ranked in an automated way.

A few examples: Cyclical and non-cyclical stocks should be evaluated differently, while certain sectors have their specific metrics (like REITs). I would never sleep well without having a thorough look at how well the company employs its capital (I am looking for consistently high return-on-invested-capital) but I wouldn’t rank and eliminate firms based on this metric alone. Last but not least, I am also calculating what total return I can expect from the investment based on very conservative assumptions about growth and valuation multiples. This is a time-consuming and knowledge-intensive step that is only carried out with the stocks that seem to deserve it.

As a result: The FALCON Method gives the list of Top 10 stocks that best fit the “quality merchandise on sale” description in any market environment. I also like to highlight my Top Picks from this list every month that may not be the stocks that are ranked highest since not all the qualitative factors are represented in the scoring system.

+1: When to Sell?

This is a buy and hold approach so selling occurs rarely; only when a stock becomes extremely overvalued, or if it reduces its dividend. A dividend cut means that the investment theme is broken and action must be taken since dividend cutters tend to underperform.

“When the facts change, I change my mind. What do you do, sir?” John Maynard Keynes

Source: Dividends for the long term (J.P. Morgan Asset Management)

While a dividend cut is a clear sign, extreme overvaluation cannot be identified by a single metric like a P/E above 40. I always look at the historical ranges of the dividend yields and various valuation metrics and I only push the SELL button (and send out an alert about this decision) if most of the indicators point towards that direction. Stocks that became overvalued have subpar total return potential as the data shows so there is no reason to hold them.

Source: The Case for Value by Brandes Investment Partners

How to use this info?

You can get the ready-to-use stock picks of the FALCON Method straight to your inbox every month if you give the Newsletter a try. Currently, there is a 7-day free trial, so you are truly not billed for 7 days. Have a look at the newsletter and if you don’t like it, just email me at david@thefalconmethod.com within the first 7 days and you can opt out without paying anything. If I were you, I would use the discount code that is included in this free guide to get the best deal.

The newsletter comes with an easy-to-use one-page summary and it also includes the detailed analysis of the Top 10 stocks. You have everything there to start building your portfolio.

If you have questions, email me and I will reply to you personally, in most cases within 24 hours.

Want to learn more about the FALCON Method before giving the newsletter a try? Check out the book!

Get my FREE Guide on Investing!

Discover how to build passive income and wealth with the confidence that evidence-based investing can give you.

This one habit changed my life!

When I made the decision to become an investor and aim for reaching financial freedom through investing I knew I had a lot to learn. I decided to read at least one hour per day. This is exactly what Brian Tracy recommends. He says that picking the topic that interests you and devoting a single hour per day for reading about it will raise your level of knowledge to such a degree that within a few years you will be regarded as one of the experts on your chosen topic in your country. It’s so true! This single habit has changed my life but it was not that simple in the beginning.

When you start out reading and have no background knowledge you will notice that some reputable authors (investors is my case) are contradicting each other. I always take notes and after the first 10 books I felt puzzled because one of the top investors said A and the other one said B, the exact opposite. I had absolutely no chance to tell which of them was right so all I could do was to move forward: read, read, read and get some own experience so that things would start to crystallize at a later stage.

I’ve been reading 50-70 books per year for several years now. Besides taking notes I also devoted long hours to sitting in front of a blank piece of paper and trying to put together, synthesize what I have learned. This painful and long process led to the birth and fine-tuning of the FALCON Method. If you want to become a do-it-yourself investor, the best advice I can give you is to start reading today! Warren Buffett reads 5-6 hours a day and he is one of the best investors on the planet. This is no coincidence.

What should you read?What if I told you there is a book that distills all I learned and makes it available to you within a few short hours instead of the years I had to put in? Would it be a good start? Hundreds of books and years of experience condensed on 130 pages, this is what the FALCON Method book offers. (I certainly could have used such a book to steer clear of some of the most expensive ‘dead end adventures’ of my investment journey like microcap investing or highly leveraged trading.)  Save time and get your attention focused on the factors that really determine your returns.


Check out the book on Amazon!

Don’t forget: whenever you start out in a completely new field, you will feel the lack of confidence that is absolutely normal! The best you can do is to shorten this initial timeframe by learning from someone who has been there, done that.

Question: What is your favorite book? (Doesn’t have to be investment related.) My Amazon wish list is growing at an extraordinary pace so please, show no mercy: send me your book recommendations!

Are you a trader or investor type? A comparison I bet you’ve never seen

There is no ‘one size fits all’ solution to reaching financial freedom so I am ready to admit that the FALCON Method is not able to help everyone. In this post I want to highlight the major differences between two approaches: trading and investing. As a result you’ll get an idea which might fit you better and whether you should utilize the FALCON Method.

Those eye-catching ads about quick profits

You must have seen tons of ads that want to convince you to become the next ‘forex superhero’. One thing these have in common is that they are advertising some insane rates of return suggesting that you could get very rich overnight. Are those rates achievable? For some lucky few and for a short sample period: SURE! The problem is that the percentage of people who can consistently make spectacular returns by trading is very low.

In fact I had the chance to see one of these companies from the inside and the percentage of successful clients was in the low single digits! They told me it was the standard level in their industry. What about the rest of the people? The typical client deposited some money which he lost within the first few months of trading. Certainly not the story they signed up for… and this is the reason why these companies have to advertise aggressively: their newly acquired clients’ account balances are converging to 0 at a very rapid pace.

What if you calculate an expected return for trading?

Say that a successful trader makes a 50% annual return on his account balance consistently. I deliberately overstate this figure to illustrate my point. Now say that 5% of the ‘wannabe trader superheroes’ succeed in this quest and the rest of them loses his account balance on the way. (This is a huge simplification, again for the sake of illustration.)

Based on these assumptions the expected return of trading would be the 50% expected annual return multiplied by the 5% probability of reaching it. This amounts to 2.5%. You have never seen such a calculation in those shiny ads, I bet! I encourage you to use your own assumptions as inputs and do your own math.

Why is the failure rate so high?

Mainly because of our inborn psychological biases. The way our brain is wired helps us survive but these same instincts are not the best for stock market success, to say the least. Most people cannot handle the constant stress and decision making that is required for trading success and they fail. The higher the number of decisions you need to make the higher your emotional involvement and the level of stress can be. Trading is not a calm pastime activity for most people. Far from it…

What about investing?

Investing involves long-term commitment. You do not buy some stocks with the intention of selling them within a few days or a few dollars of price movement.  Instead you identify quality stocks that are available on the cheap, buy them and let your money work in them as long as the company is doing its job. Have you read the case study of my Cracker Barrel investment? You can see that this approach is not that stressful and hardly involves decision making after a thoughtful purchase.

This means that the psychological burden of investing is much lighter than that of trading and this translates to a significantly higher success rate among the people who choose this way.
Let’s say that a good investor can achieve a 10% annual return consistently and 50% of the people are capable of doing this. These assumptions would lead to an expected rate of return of 5% that is the double of what we got with the trading scenario. (Don’t let these absolute values freeze you since they are totally meaningless on their own! Again, use your own numbers, I just wanted to give you a framework to think.)

I strongly prefer the low-stress way of achieving great returns with the odds on my side to living a stressful life with the ill intention to get rich quick while fighting against the odds.

As a summary: the FALCON Method will work for you, IF…

  • You think long-term.
  • You have a “saver and investor” mindset.
  • You want performance, not excitement. (This is not an adrenaline-packed trading system but an evidence-based long-term investment strategy. The difference is night and day.)
  • You favor a “trust but verify” approach and want to see for yourself why the FALCON Method has very high probability of superior performance.
  • You are able to stick to a strategy and do not deviate from it.
  • You appreciate that you do not have to devote your whole life to learning and practicing investing.
  • You appreciate transparency and total honesty.

The good news is: there are no more IFs. Absolutely no qualifications, inborn talents or special skills are necessary. Once you feel your mindset fits most of the above criteria, you have found what you are looking for.

“Investing should be like watching paint dry or watching grass grow. If you want excitement…go to Las Vegas.” Paul Samuelson

How I made 96% profit with a system you can easily replicate

This story started in May 2014 when I received a free dividend newsletter full of eye-catching titles. I was subscribed to all the free stuff on the internet at that time so I really had to filter out the noise if I wanted to keep my life together and not spend all the day with my inbox. Most of the time all I did was to scroll through such newsletters in a few moments and I hardly ever clicked on any of the articles included.

This time a title said that a company I’ve never heard of (Cracker Barrel) increased its dividend 33% but the market failed to notice it and the stock price had hardly moved. This grabbed my attention and I thought to myself: why not have a look at this story? I had a very simple investment process back then and I wanted to check how well this company fit. Here’s what I focused on.

This was the 12th annual dividend increase from Cracker Barrel in the previous 12 years which showed me that the management was serious about returning money to the shareholders. This dividend history clearly signaled that the willingness to pay a dividend is most certainly there

As a next step I wanted to explore how much cash this company was making so that I could gauge how safe the dividend seems to be. I came up with some quick and easy calculations the summary of which you can see on this chart:

At this point I started to become interested, since Cracker Barrel seemed to have a very well covered dividend, a decent history of paying and had just raised the dividend by 33% which told me that the management was more than optimistic about the company’s future. (So not only the willingness but the ability to pay was there as well.)

The stock’s current yield was above 4% that was much higher than the market average that time, and this 4% was most certainly higher than the average dividend yield of Cracker Barrel. The following chart told me I may have an opportunity for a bargain purchase here.

The dividend history was OK, the coverage was more than adequate, the current yield and the growth rates were spectacular and the stock seemed to be cheap in historical comparison. I pressed the BUY button at a price of $95.31.

And now comes the boring but profitable part of the story. This Cracker Barrel did nothing but kept raising its regular quarterly dividends and paid me a special dividend annually as well. The table below shows that by the beginning of August 2017 I will have recuperated more than 25% of my original investment in the form of dividends.

Since the total return has a price and a dividend component as well it is time to look at the stock price. At the time of this writing Cracker Barrel trades at $163.3, which means that I am sitting on an unrealized profit of 71.4%.

My plans for the future? As long as this company keeps raising its dividends and is paying me nearly 9% of my initial investment every year (regular and special dividends combined), I see absolutely no reason to sell. My investment method is about buying right and holding onto my cash cows thereafter until they become extremely overvalued. Cracker Barrel is far from that level at the moment so I’m in for some calm and lucrative dividend harvesting.

Get my FREE Guide on Investing!

Discover how to build passive income and wealth with the confidence that evidence-based investing can give you.

Investing was my most expensive hobby! Learning these 4 lessons made the change

When I started out in investing (in my 20s) I was nothing special. I had no confidence, no extra knowledge, just a burning desire that I wanted to get my money to work and produce passive income so that I could leave the work I didn’t like. (I was running my own company which made things more complicated. On one hand I had the money to invest, on the other hand quitting your own company is not the easiest of things.)

Lesson 1: Your financial status and level of knowledge always converge.

I was a guy with a relatively low level of investment knowledge and a high amount of money to put to work. “A fool and their money are soon parted” you know. Since getting my knowledge level up was not a short process, but the money part of this equation could move much faster, the result was that I’ve lost plenty of money with various investments during the years I was building up my knowledge. (Money level moving quickly downhill, knowledge level slowly climbing up… it was utterly painful until the point these two met somewhere in the middle.)

For the sake of illustration: I invested in exotic property (a hotel in Thailand to be more exact that was really hard to sell), a sheep farm (lawsuit still in progress), forex robots (all of which lost money), some outright Ponzi-schemes (most of the perpetrators are in jail), startup companies (with dishonest partners) and stocks of disastrous public companies. My journey to success was very long, painful and expensive. In fact, investing was a very expensive hobby until I figured out how to do it right!

At some point, I found an investment newsletter many people were raving about. Its title even included the magic word “dividend” and I thought my savior arrived: a guy who knows how to pick stocks that would provide the passive income I so desire. I subscribed to his newsletter and at first I felt somewhat uncomfortable with his recommendations. By this point I have read tons of investment books but I was very far from coming up with my own system, so I just suppressed my feelings and followed this ‘expert’.

One of the stocks he got me to buy was Transocean (RIG). I never really understood his reasons behind this purchase since this didn’t look like a safe dividend stock to me and he was very secretive about his stock picking system. Long story short: the company stopped paying dividends and the share price fell from $38 (where I bought) to single digits. That really hurt! This was the wake-up call I needed.

I started thinking. (Better late than never…) What do all my failed investments have in common? In most cases I totally relinquished control and didn’t fully understand how these investments worked and could make money. All the guys selling these investments were sales and marketing superheroes, their confidence seemed to be sky-high (compared to mine at that time), but the actual results I got were woeful.

Of course the newsletter guy kept smiling, dusted himself off and went on to get new subscribers to fill the void left by the ones whose financial lives he managed to ruin. Following his recommendations was very stressful for me since I didn’t understand the underlying logic so I didn’t have a conviction about any of the stocks that landed in my portfolio. Can you imagine how you’d feel if one of your stocks fell by 80% and you knew nothing about the company?

Lesson 2: Relinquishing control over your money never works.

Do you notice the pattern I’ve followed? I tried to escape the responsibility of managing my own money as I found it stressful. What I got in return was more stress and dreadful results. Successful people take responsibility and want control.

Lesson 3: Never invest in anything you do not fully understand!

Keep asking. If you do not get the answers that make you comfortable with the decision, have the confidence to say no and walk away. Looking back, even in my late 20s I knew much more than most people on the other side of my failed investment stories, yet my lack of confidence let them walk away with my money.

Lesson 4: Is it a system, a structured process or just some fancy marketing?

Selling an investment to someone who is not an experienced investor is really easy. A guy with no integrity can always come up with a story that sells. But here’s the catch: can that person describe what structured thought process, what kind of system led him to the investment opportunity he is proposing? Only invest if there is an underlying process you can fully understand. If you keep asking and really want to discover an investment system only the honest guys will keep answering. All the get-rich-quick salesmen will rather go for the easy money and yell: “Next please!”

You most certainly don’t want to be that “next” person. Learn from my mistakes, save years of agony and plenty of money by having the confidence to only invest in something you understand; or better yet: follow a well-structured investment process you understand instead of blindly trusting the sales guys out there. Understanding leads to peace of mind and this is crucial for both long-term results and a quality life.

If you enjoyed the blog post about my crazy investment stories and have a few minutes, let me know what your worst investment was so far, along with the lessons you’ve learned. I read all my emails and I would be happy to hear from you.

Get my FREE Guide on Investing!

Discover how to build passive income and wealth with the confidence that evidence-based investing can give you.

Coke’s Investors Are Swimming Against The Tide

Summary

  • “Religion stocks are not safe stocks. Irrational faith and false perception of safety come at a large cost: the hidden risk of reduction in the religion premium.” (Vitaliy Katsenelson).
  • Two components of the total return equation are clearly against Coca-Cola investors. The dividend alone will not save them.
  • Buying the stock today is like playing musical chairs and expecting the music to never stop (expecting investors to continue paying a lot for a little).
  • See how Coca-Cola fares according to the FALCON Method.

Coca-Cola (NYSE:KO) is an iconic American company. Most people think it is one of the safest stocks to invest in and this conviction elevates it to religion stock status, meaning chronic overvaluation.

Religion stocks are not safe stocks. Irrational faith and false perception of safety come at a large cost: the hidden risk of reduction in the religion premium. The risk is hidden because it never showed itself in the past. Religion stocks by definition have had an incredibly consistent track record. … It is hard to predict how far the premium will inflate before it deflates – but it will deflate eventually. When it does, the damage to the portfolio can be enormous. -Vitaliy Katsenelson in his book Active Value Investing

Here’s what catches the eye

Coca-Cola is a dividend champion with 55 straight years of higher dividends. Not too many companies of this kind offer a dividend yield of nearly 3.4% these days when the S&P 500’s benchmark level is below 2%.

On the top of this the current yield is well above Coke’s historical average, so it could seem wise to scoop up these quality shares while they are on sale. But are they really on sale or do many investors miss an important point?

Dividend yield of Coca-Cola (KO); Source: FAST Graphs

The dividend is just one of the 3 building blocks of total return

Equity returns come from two sources: stock appreciation and dividends. Stock appreciation is mathematically driven by two variables: earnings growth and price-earnings change. So we have three components of total return: dividends, growth and the valuation multiple. Having already touched on the dividend part, let’s turn our attention to the other two.

The non-existent growth: If you look at the diluted earnings per share and the free cash flow per share data of the last 5 years the best word I can come up with is “stagnant.”

Source: FAST Graphs

The overextended valuation multiple: Currently you need to pay more than 23 times earnings for the shares of a company the growth characteristics of which leave a lot to be desired. Stocks with such a growth profile deserve a P/E multiple closer to 15 based on historical data. Can Coke’s multiple still shoot up to the 30s or 40s? Sure! Why not? But speculating on that would be reckless.

What can go wrong?

Let’s play with the numbers a little bit. Assume that Coke continues to pay its dividend, which seems to be a very safe bet. Assume that the company’s earnings don’t grow, and its P/E ratio declines to 15 (which is far from an irrational level) within five years. In this scenario, turning to the total return equation shows that over this five-year period the investor will receive 3.4 percent dividend + 0 percent earnings growth minus 8.2 percent P/E decline per year = -4.8 percent a year. (If the P/E ratio declines 8.2% every year it will land on 14.99 at the end of our five-year period.)

Now if you find this example too abstract (or shocking), take a look at the calculations below that include analyst estimates and a P/E multiple of 15 at the end of the period. The annualized total return is 0.38% in this scenario. It is really hard to win if two components of the total return equation are against you but you are still swimming against the tide since the dividend is the only factor you focus on.

Let’s see how a well-structured investment process could highlight these problems and prevent you from making a costly mistake!

A quick look at how Coca-Cola fares according to the FALCON Method

The FALCON Method is a structured stock selection process that serves the construction of a buy and hold portfolio with both an income and total return focus. The model is about 90% quantitative and 10% qualitative. The process includes the following steps.

Step1: Narrow down the field of stocks. I focus on a group of stocks that tend to outperform according to historical data. My minimum requirement is 20 years of immaculate dividend history, meaning there are no dividend cuts within this period. Coca-Cola easily PASSES, since it is a dividend champion with 55 straight years of higher dividends.

Step2: Check the valuation. I focus on the stocks that seem to be undervalued historically based on various metrics.

 current3yr5yr10yr15yr20yr
P/E23.121.721.319.619.722.6
P/FCF28.427.424.522.622.226.3
P/EBITDA16.615.515.114.014.115.8

Source: S&P Capital IQ, FAST Graphs

Current figures are based on blended ratios, meaning a weighted average of the most recent actual reported earnings plus the closest quarterly forecast earnings.

You can see from the figures above that the historical averages of these multiples are rather high, showing that the religion premium is absolutely “normal” for Coke. However the current valuation ratios are even higher than the historical averages and investors are paying such prices for a company that has not shown any signs of growth (in earnings and cash flow) recently.

I believe valuation is not an exact science and we should think about certain ranges of these multiples rather than exact levels. However, no matter what glasses I put on, Coca-Cola cannot be categorized as undervalued today, and for my taste it is not even fairly valued. Coke FAILS the test of valuation, so the FALCON Method would not allow me to buy this stock at the current price. (I am still showing you the remaining steps, since they have some important messages.)

Step3: Three hurdles to filter them. I use absolute threshold criteria (dividend yield, free cash flow yield and shareholder yield) to determine whether a stock is good enough to invest my capital or I should pass up the opportunity. I deliberately define low limits with all the 3 indicators, since my experience shows that meeting all 3 low requirements together usually disqualifies a very large chunk of stocks on my list, but leaves just enough of them to continue the analysis. So this is a very tough combined filter in spite of seeming to be a bit lenient on the single factors.

Dividend YieldFree Cash Flow YieldShareholder Yield
3.4%3.6%5.1%

Source: Morningstar, based on TTM data

Most investors find Coca-Cola attractive because of its high dividend yield and immaculate dividend history. However you should notice that the company is paying out nearly all its free cash flow as dividends meaning that the coverage looks awful with a FCF payout ratio of about 95%. I would never invest in a stock offering a 3.6% FCF yield. This is what the absolute hurdles are for and these figures point towards a very clear FAIL at this step as well.

Step4: Rank the survivors. I am using a multifactor quantitative ranking the factors of which are mostly Chowder-like numbers of different timeframes. Coke ranks 114th of the 322 stocks of the FALCON Method – surely not an opportunity I would get excited about at the moment.

Step5: Enter the human. This step involves some qualitative judgment, but it is far from a Buffett-like deep analysis since not too many of us can carry that out at such a level and with that kind of confidence.

Religion stocks often pass the quality test with flying colors, as past success was driven by a strong sustainable competitive advantage. -Vitaliy Katsenelson in his book Active Value Investing

There is no question about the quality of the Coca-Cola Company. Valuation is an entirely different matter. I would not recommend buying Coke at the current levels. The company should either start showing some growth or the price should reflect the no-growth scenario. Until one of these happens, there are much better opportunities out there.

Takeaway

Coke has been commanding a religion premium for ages. Will this continue indefinitely? Buying the stock today is like playing musical chairs and expecting the music to never stop (expecting investors to continue paying a lot for a little). Buying Coke at these levels is more like gambling than investing since two components of the total return equation are clearly against you. The all-round stock selection process of the FALCON Method prevents us from making such mistakes and directs our attention to the most attractive dividend paying stocks in any kind of market.

Get my FREE Guide on Investing!

Discover how to build passive income and wealth with the confidence that evidence-based investing can give you.

Here’s What To Learn From Warren Buffett’s IBM ‘Mistake’

Summary

  • Investing the Warren Buffett Way involves a huge portion of educated guesses about the future competitive position of a company.
  • “The difficulty is that we don’t know the factors that predict future sustainable high returns on invested capital.” (Tobias Carlisle).
  • A structured decision-making process built on evidence-based quantitative factors is the best approach to investing unless you have Buffett’s genius.
  • See how IBM fares according to the FALCON Method.

Nobody is infallible. Not even Warren Buffett. He is an extraordinary investor who happily admits to making mistakes and predicts this to continue as long as he lives. This article is not about crucifying him (for something that might not be a mistake at all) but to draw valuable conclusions from his latest comments on Berkshire’s IBM (NYSE:IBM) investment.

Could be a mistake

In 2016 Buffett said his IBM investment “could be a mistake.” He has become much more articulate about his position lately:

“I don’t value IBM the same way that I did six years ago when I started buying, I’ve revalued it somewhat downward … When it got above $180 we actually sold a reasonable amount of stock.”

To understand what has changed we must have a quick look at how Buffett invests.

It’s all about those wide-moat companies

Warren Buffett is constantly looking for firms that have a competitive advantage, allowing them to earn a consistently high return on invested capital. This advantage (the moat around the castle) must be sustainable so as to prevent competitors from invading the company’s market and pushing down profitability as a result.

Investing the Warren Buffett way requires a tremendous amount of industry knowledge and expertise in business analysis. This cannot be achieved without total devotion to lifelong learning.

“I read and read and read. I probably read five to six hours a day.” Warren Buffett

Here’s the problem (for most of us)

Capitalism is all about reversion to the mean. If a company is earning extra-high returns on invested capital, others will be attracted to its field. As soon as the newcomers put some money to work in that lucrative-looking market they can spoil the party by creating an oversupply. (And many other ways.) As competition intensifies rates of return tend to sink.

The problem is that investing the Warren Buffett way involves a huge portion of educated guesses about the future competitive position of the company. This is a really tricky part.

“It’s one thing to note post hoc that some companies did sustain high or low returns on capital over the period examined, and quite another to do it ex ante, or before the fact. The difficulty is that we don’t know the factors that predict future sustainable high returns on invested capital.” (Tobias E. Carlisle in his book Deep Value)

In fact, this is exactly what Warren Buffett seems to have got wrong, at least according to his latest remarks:

“I think if you look back at what they were projecting and how they thought the business would develop I would say what they’ve run into is some pretty tough competitors, IBM is a big strong company, but they’ve got big strong competitors too.”

Existing wide moats can be identified by sustained above average ROIC (return on invested capital). While observing the past is easy there is no easy-to-identify clue as to the future ROIC of a firm.

Even Warren Buffett makes mistakes (after having spent all his life reading) and unless you have his genius for business analysis your chances of predicting the future competitiveness of a company are rather slim. Based on this, paying elevated prices for current high ROIC is an investment strategy you most likely shouldn’t follow. Mean reversion pops its ugly head and takes care of your returns.

How to tackle this problem? An article is only as good as the meaningful and actionable takeaway it offers, so here are mine.

Takeaway for the individual investor

I am most certainly not like Warren Buffett. I am not spending all the day reading quarterly and annual reports simply because I do not enjoy doing that. Fortunately, this doesn’t mean I cannot achieve investment success. Let the man himself address this point:

“So the really big money tends to be made by investors who are right on qualitative decisions but, at least in my opinion, the more sure money tends to be made on the obvious quantitative decisions.” Warren Buffett, 1967

Buffett achieved his highest returns as a mostly quantitative investor before Phil Fisher and Charlie Munger influenced him to form his current style of investing which is not suitable for most of us (lacking Buffett’s extraordinary qualities and overwhelming devotion).

So what do I do?

After reading hundreds of investment books and gaining valuable (sometimes painfully expensive) experience I have figured out the following:

  • A sensible investor should never follow any “guru” (even if he is called Warren Buffett) into any position. Blindly copying, coat-tailing others will make you vulnerable and stressful since you do not know what you are doing.
  • You can never eliminate the uncertainty about a company’s future from investing. However there’s an intelligent way to address this. (Do not create a concentrated portfolio of stocks based on qualitative judgment unless your initials are W.B.)
  • A structured decision-making process is the best approach to investing. I have built my process on evidence-based quantitative factors the combined use of which tilts the odds of superior performance in my favor. Investing is probabilistic and never deterministic, so this “odds tilting” is the best you can do.
  • If you are not devoting your whole life to reading and investing, do not give too much room for qualitative decisions. It is complacent or outright crazy to believe that you will become the next Warren Buffett without making the same sacrifice he has made.
  • Based on the above, I am utilizing an evidence-based investment process that is about 90% quantitative and 10% qualitative. I only let qualitative factors creep in when the field of stocks is narrowed down to such an extent it would be really hard to make a costly mistake.
  • My process serves the construction of a buy-and-hold stock portfolio that is not highly concentrated. This portfolio produces dependable and growing passive income in the form of dividends while also having extraordinary total return potential thanks to the factually proven quantitative factors behind stock selection.
  • I do not have to spend all my time with my investment decisions so I can live a meaningful life while employing a sensible approach to build wealth.

What about IBM in particular? If that stock ranks well in my all-round selection process (which it most certainly does at the moment) then I’m ready to buy a small position for my portfolio. My experience shows that most of these positions tend to work out really well, while only a few of them underperform. Picking stocks with the proven factors of outperformance and reliable dividend stream in mind can lead to great results on a portfolio level. And most importantly, it is a low-stress way: I don’t need to worry that Warren Buffett forgets to give me a ring next time he sells some of his positions I blindly followed him into…

A quick look at how IBM fares according to the FALCON Method

The FALCON Method is a structured stock selection process that serves the construction of a buy and hold portfolio with both an income and total return focus. The model is about 90% quantitative and 10% qualitative. The process includes the following steps.

Step1: Narrow down the field of stocks. I focus on a group of stocks that tend to outperform according to historical data. My minimum requirement is 20 years of immaculate dividend history, meaning there are no dividend cuts within this period. IBM has been raising its dividend for 22 years now, so it passes easily.

Step2: Check the valuation. I focus on the stocks that seem to be undervalued historically based on various metrics. IBM looks to be available slightly on the cheap side of its historical valuation. Not a huge bargain I would say, but the current market does not offer too many quality stocks at fair or better prices. IBM passes this test as well.

 current3yr5yr10yr15yr20yr
P/E11.012.210.411.912.815.5
P/FCF11.612.411.912.913.316.9
P/EBITDA7.78.67.27.67.78.6

Source: S&P Capital IQ, FAST Graphs

Step3: Three hurdles to filter them. I use absolute threshold criteria (dividend yield, free cash flow yield and shareholder yield) to determine whether a stock is good enough to invest my capital or I should pass up the opportunity. I deliberately define low limits with all the three indicators, since my experience shows that meeting all three low requirements together usually disqualifies a very large chunk of stocks on my list, but leaves just enough of them to continue the analysis. So this is a very tough combined filter in spite of seeming to be a bit lenient on the single factors. Again, IBM easily passes.

Step4: Rank the survivors. I’m using a multi-factor quantitative method ranking the factors of which are mostly Chowder-like numbers of different timeframes. IBM ranks 56th of the 322 stocks based on the combined “yield-plus-growth” indicators, yet when all the companies are excluded that fail to pass the three absolute threshold criteria or seem to be overvalued in historical comparison IBM becomes a Top 10 stock in the FALCON Method. (No surprise here: most top quality stocks are clearly overvalued today.)

Step5: Enter the human. This step involves some qualitative judgment but it is far from a Buffett-like deep analysis since not too many of us can carry that out at such a level and with that kind of confidence.

The company is earning high returns on invested capital, its dividend is more than adequately covered and playing with FAST Graphs gives me an estimated annualized rate of return between 8%-12% in the most conservative scenarios. For me, IBM near the $150 price level is clearly not a sell.

Get my FREE Guide on Investing!

Discover how to build passive income and wealth with the confidence that evidence-based investing can give you.

Where Can I Send
Your Guide?
Enter your name and email address below to get instant access.
Send Me The Guide
You will only get top-notch content from me.
close-link
Where Can I Send
Your Free Course?
Enter your name and email address below to get instant access.
Send Me The Course!
You will only get top-notch content from me.
close-link
You Can Watch The Replay Instantly...
Enter your name and email address below to get instant access.
You will only get top-notch content from us.
close-link
Upgrade your stock investing process...
Enter your name and email address below to get instant access.
You will only get top-notch content from us.
close-link