In the first part of The Compounder’s Path Series, we delved into the crucial foundation of a sound investment strategy: building an Investable Universe grounded in historically proven factors.
We discovered that a manageable number of companies, carefully selected, can make the difference between financial success and a risky gamble. We also touched upon why blindly following your instincts or other people’s advice can be a one-way ticket to disappointment.
Today, let’s dive deeper into the heart of a successful screening process, i.e. metrics.
These numerical indicators are the compass guiding you through the labyrinth of the financial markets. They help you make informed decisions, reduce risks, and maximize returns, assuming that you follow the right approach. And while being a successful investor takes way more than pure number-crunching, understanding and employing the right metrics can put you ahead in the game.
Let’s see what inexperienced investors get wrong most of the time.
The Metric Maze
One common misconception is the belief that more metrics will guarantee better investment outcomes. It’s easy to fall into this trap, thinking that an arsenal of 37 different metrics will provide a clearer picture of a company’s potential. However, the reality is quite the opposite.
While a multifaceted approach is undoubtedly warranted, meaning you should consider various business characteristics like business quality, profitability, or growth, the key is to keep things as simple as possible while ensuring that your screening process is “good enough”.
When you drown yourself in a sea of numbers, it’s not clarity that emerges but rather confusion and complexity. You will not know how to prioritize among the myriad of metrics available to you. This overload can be paralyzing and lead you down a path of uncertainty.
In our experience, 4-5 metrics can tell you all you need to know about a business number-wise. When it comes to building a great screening process, the quality of inputs used in your analysis is far more important than quantity.
The Valuation Trap
Another pitfall that ensnares many aspiring investors is the tendency to prioritize valuation as the initial step in their screening process. While valuation is undoubtedly an essential factor to consider, placing it at the forefront of your analysis can lead to several issues that undermine your investment journey.
Imagine, for a moment, that your primary focus is to identify stocks trading at a discount to their intrinsic value. It seems like a reasonable approach, doesn’t it?
However, this methodology often leads to a revolving door of new names every time you run your screening process. This results in an overwhelming amount of work, tracking, and analysis, which we discussed in our previous article can be an exhausting and inefficient pursuit.
Furthermore, by primarily focusing on valuation, you may inadvertently cast a wide net that encompasses a vast variety of businesses. Some of these may be high-quality firms, while others (or shall we say the overwhelming majority) will be less reputable companies that lack a sustainable competitive advantage, or even bordering on the ‘junk’ category. These companies might appear statistically cheap at first glance, but delving deeper, you will find that they carry excessive risk and lack the fundamental characteristics of solid investments.
Consider this scenario: You’ve identified a stock trading at an unbelievably low price compared to its earnings or book value. It’s tempting to think you’ve found a hidden gem. However, what’s beneath the surface?
Does the company have any sort of “moat” around its business which protects it from competitors? Does it have sufficient growth prospects and a great management team? Focusing foremost on valuation can lead you astray in these situations, that’s why we firmly believe that valuation metrics should not be a part of your initial screening process.
The Deception of Conventional Accounting Metrics
Here comes (arguably) the most important mousetrap to consider: the undue trust placed in conventional accounting metrics as the sole determinant of a company’s true economic value creation. You have to accept the fact that accounting is not meant to help investors but to calculate taxes. Therefore, accounting numbers are easily manipulated, and any multiple based on these reports is misleading and dangerous.
We have written an entire article about proving these points, but just to summarize things:
- Accounting treats shareholders’ equity as free money (distorts earnings)
- Accounting treats two identical investment decisions differently (distorts earnings)
- Accounting provides ample room for management to play with certain items (distorts cash flow)
- P/E, P/FCF, P/EBITDA, P/BV, ROI, and ROIC are also badly distorted, thus not suitable to base serious investment decisions on them
- Even the PRICE component in the commonly used multiples leads to distortions because of differences in capital structures (distorts all multiples using the P component)
- Earnings growth can be high and still lead to shareholder value destruction (not all growth is good)
To illustrate our point, let’s examine the case of AT&T between 2009 and 2022.
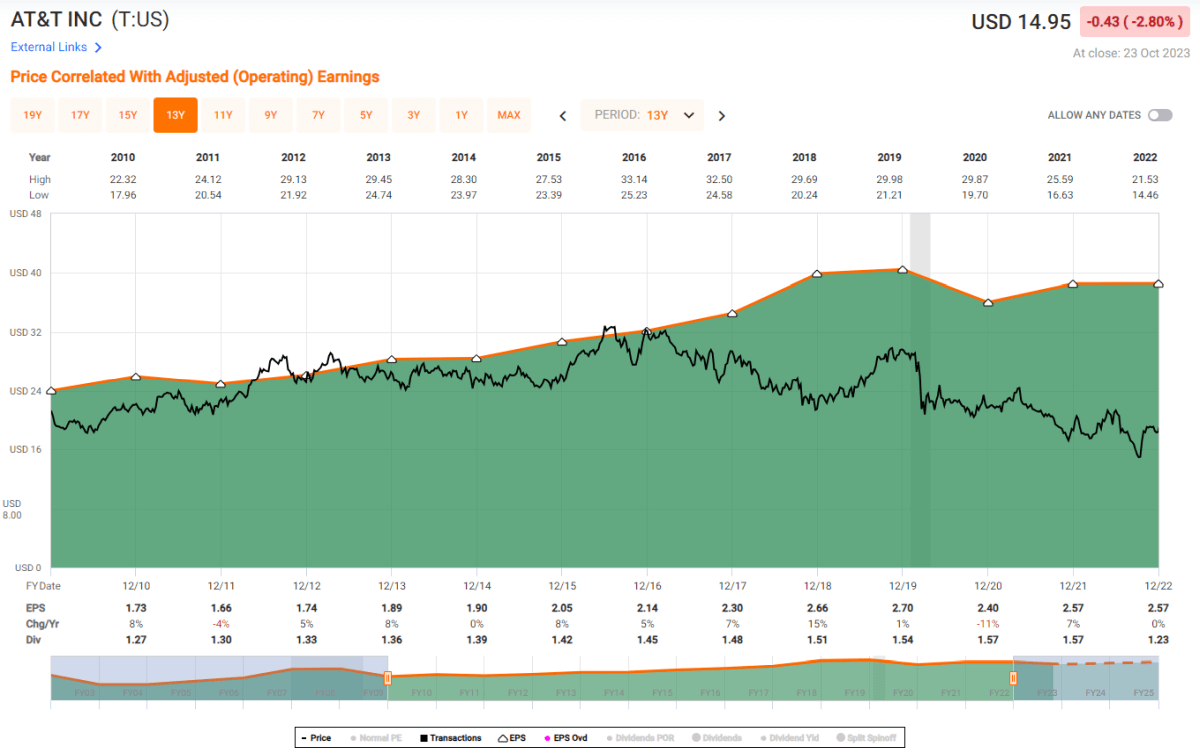
During these 13 years, AT&T’s EPS (the shaded green area) grew from $1.60 per share to $2.57, representing a growth of over 55% over this timeframe. However, here is the puzzling discrepancy – the share price remained largely stagnant over this time.
How can this be? The answer lies in the deceptive nature of how EPS (or FCF, EBITDA, and so on) can paint a completely false picture of true business performance.
Enter Economic Value Added (EVA), a metric that delves beyond the superficial and provides a more accurate reflection of a company’s economic profit generation. EVA takes not only the earnings into account but also the cost of capital, offering a holistic view of how effectively a company generates wealth for its shareholders.
In simple terms, EVA is a metric that measures the firm’s profit remaining after:
- Deducting all costs adjusted for accounting distortions one by one.
- Including the cost of giving the firm’s investors a full, fair, and competitive return on their investment in the business.
EVA is a comprehensive net profit score that charges for all capital used, including shareholders’ equity, which is falsely considered free money under GAAP accounting.
Let’s check how AT&T fared in the EVA framework between 2009 and 2022.
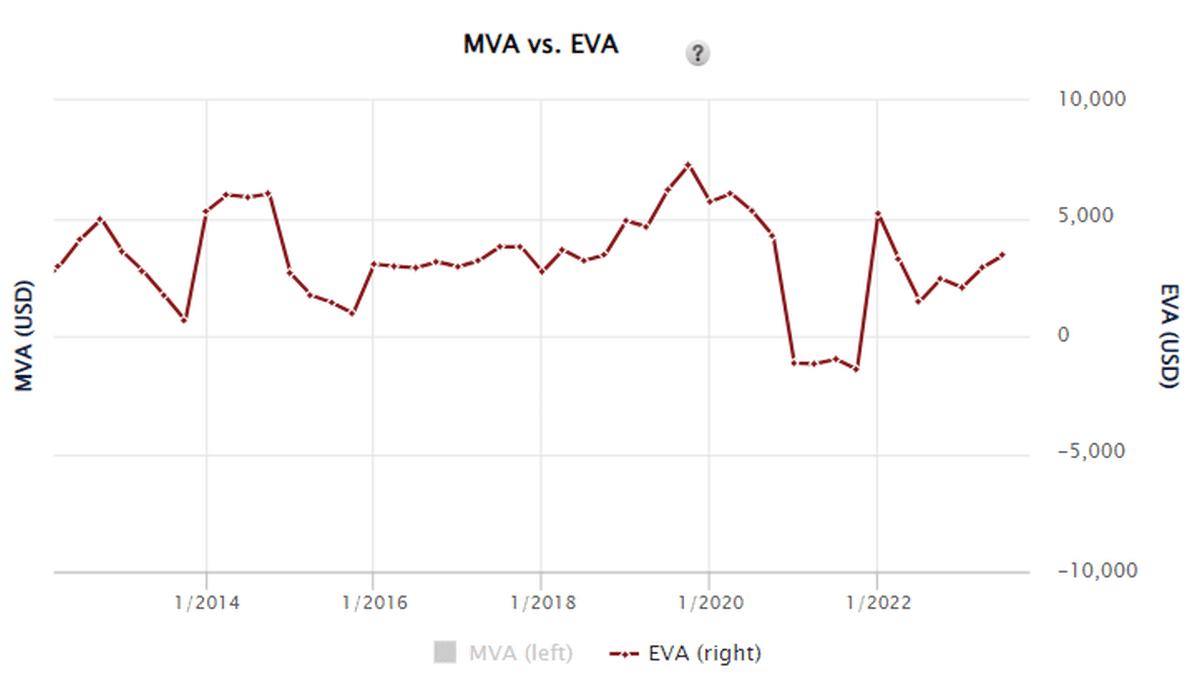
The trajectory of the red bar shows a whole different story. Despite the apparent EPS growth, the company’s EVA has remained relatively flat, suggesting that while accountants were happy with the results, the firm did not increase economic value for its owners.
Stagnating levels of EVA have led to a flat share price, no matter how much EPS has grown.
Let’s look at the polar opposite of what we have just witnessed: consider the case of Amazon between 2007 and 2015.
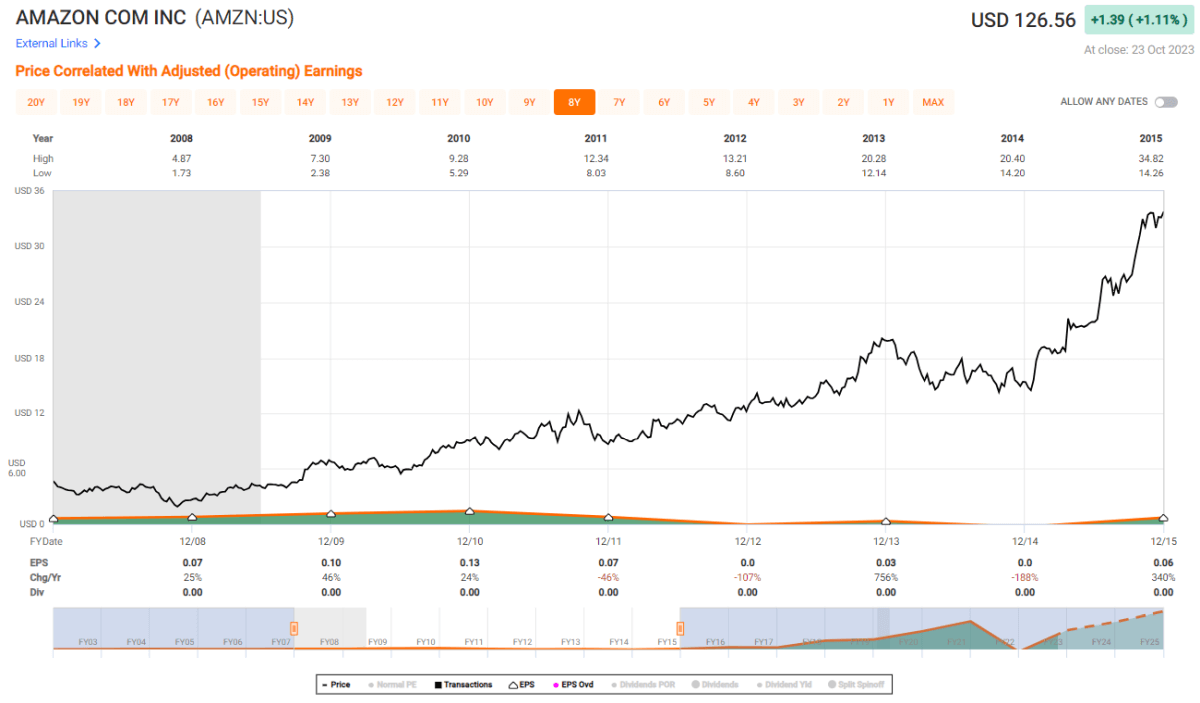
During this period, Amazon’s EPS showed little to no growth (it was $0.06 per share both in 2007 and 2015). To the casual observer, this might seem perplexing, as the company’s share price skyrocketed, growing sevenfold during the same period.
How is it possible for a company to experience stagnant EPS and yet see its market value increase substantially?
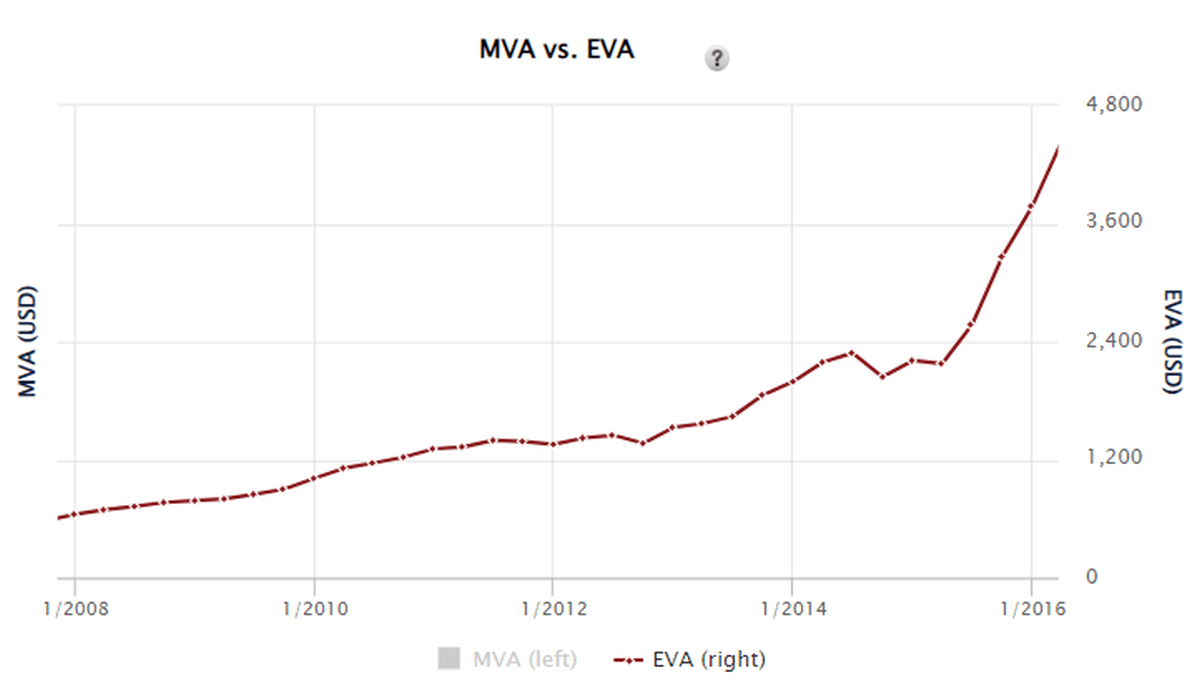
The answer lies in the stellar performance of Amazon’s EVA per share, which grew nearly in line with its share price, expanding sixfold during those eight years.
In short, you must put the quality of the data you are using above everything else when putting together a robust screening process. (And that is the reason why we spend tens of thousands of dollars annually on getting this institutional-level data at the FALCON Method.)
Crafting a Superior Screener: Focus on Quality and Growth
So far, we’ve uncovered the pitfalls associated with relying solely on conventional accounting metrics and explored case studies that demonstrate the power of true economic profit generation through EVA.
Now, let’s delve into how we would construct a top-tier stock screener that will most likely guide you toward promising investments.
Our solution lies in focusing on 2-2 key metrics that revolve around quality and growth. For instance, we use Return on Capital (ROC), EVA Margin, Sales Growth (on a 5-10-year horizon), and EVA Growth for our screening process, since these metrics, when used in tandem, offer a comprehensive view of a company’s quality and true value creation.
(You could substitute EVA with Net Income or Free Cash Flow, albeit you have seen how wildly these metrics can converge from economic reality).
As a next step, we would use these 4 metrics to narrow down the field of stocks, by assigning a composite Quality-Growth score (giving an equal weight to each factor) to every company in our screener. After ranking these from top to bottom, we would select the 50-100 firms that fared most favorably in this selection process.
You may ask, why should we narrow our focus to high-quality, durable-growth companies? Let us present two compelling reasons.
Reason 1: Double-Digit Fundamental Return Potential
First and foremost, these quality compounders possess the unique ability to ensure a high, double-digit fundamental return potential. This means that their growth, combined with dividends and the effect of buybacks, can provide market-beating performance on their own.
In other words, you don’t necessarily need the tailwind of favorable valuation to achieve superior returns. This also eliminates the need for constantly finding new investment targets, mitigating the so-called “reinvestment risk”.
These companies are the only viable option for a true buy-and-hold strategy, where you can sit back and watch the wonderful effects of decades-long compounding. You don’t need to come up with new ideas every month, every year.
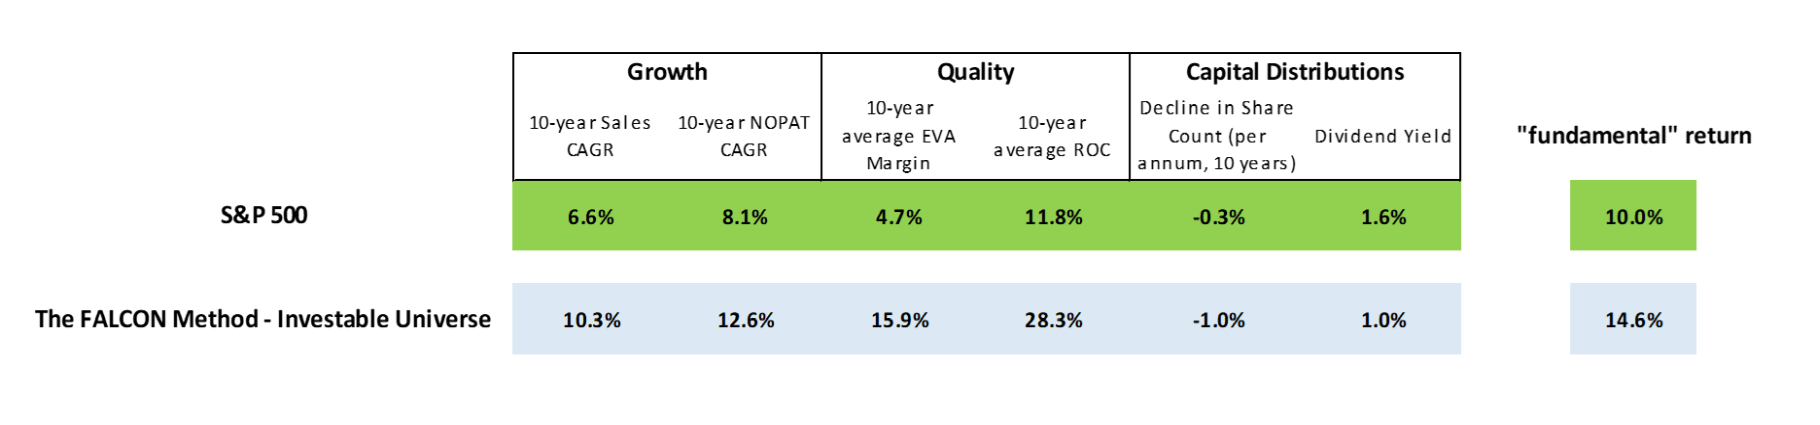
To help you better understand this concept, here is a snapshot of how the quantitative metrics and fundamental return of our Investable Universe compared with the S&P 500 over the past 10 years. You can see that we strived to establish a pool of companies where we get market-beating quality and growth characteristics, leading to an exceptional fundamental return historically.
Reason 2: Good Businesses Seldom Become Bad Businesses (and vice versa)
Great companies seldom turn bad overnight, and conversely, businesses that have consistently demonstrated poor quality don’t miraculously transform into industry leaders.
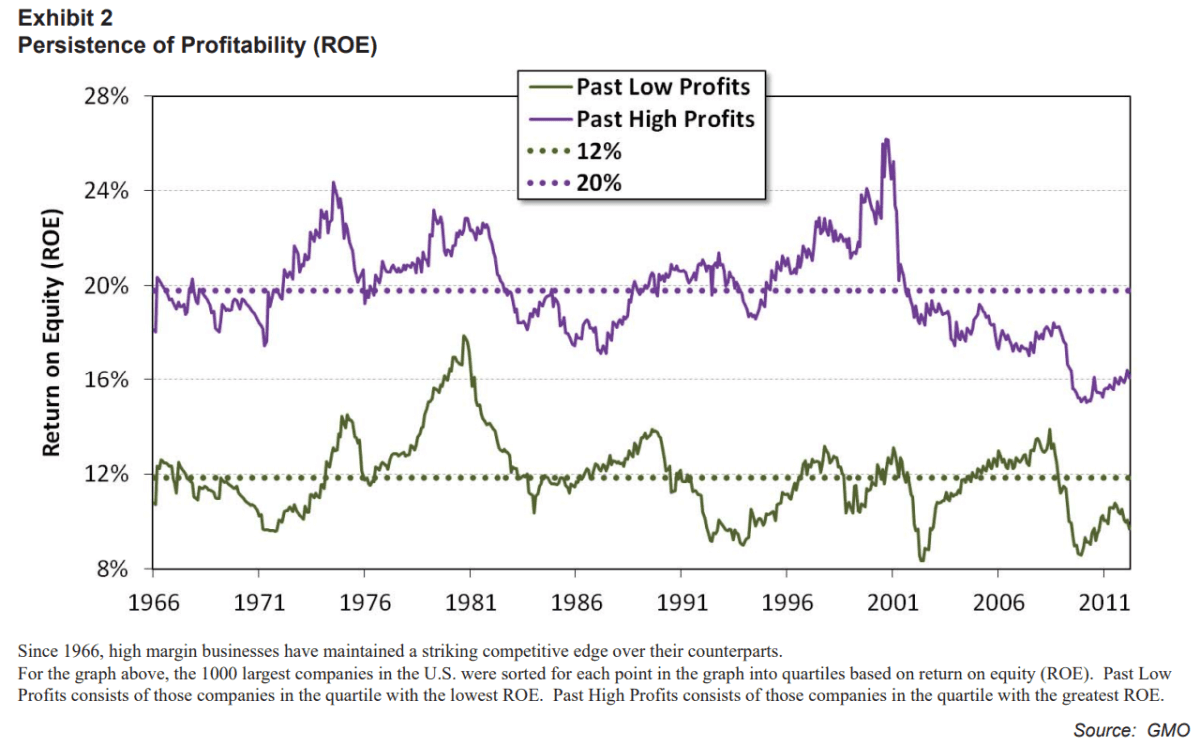
The chart below shows a GMO study that proves that companies with high ROC levels tend to remain market leaders, and firms that could not produce outsized returns on their invested capital cannot improve on this metric over time. There is no “mean reversion”. That’s why it’s important to stay invested in good companies and avoid subpar businesses like a plague.
This principle forms the backbone of our quality-focused screening process, and it’s a crucial factor in creating an Investable Universe that maintains relative stability over time.
Today, we have shown you how we would go about building a quantitative system that generates a few tangible stocks that are worth your attention out of more than 10,000. The quantitative boxes these companies have ticked are essential, but they represent only the tip of the iceberg.
To grasp the full narrative, we must also explore the qualitative aspects. In the third part of The Compounder’s Path Series, we will shed light on why you need to dig deep into those businesses that ranked high in your screening process, to earn a spot and more importantly, to remain in your Investable Universe. Stay tuned for more!
