“A wide-moat company is like a soccer team that only gets to play
friendlies.” (Rob Vinall)
In the annals of overused corporate clichés, few match the immortal words of Walter Gretzky, as passed on to the world through his son Wayne: “Skate to where the puck is going, not where it has been.” While the hockey world has yet to produce another player capable of coming close to matching Gretzky’s record, that puck quote also has some relevance to investing.
As Rob Vinall, the founder and managing director of RV Capital, contemplated in one of his memos, one should pay more attention to the direction, not the width of the moat. “If you are planning on investing in a business for a long time, then it is far more important to know whether the competition is closing in on you as opposed to the absolute width of the moat.” It’s hard to argue that competitive dynamics matter over decade-long investing timeframes, but monitoring these developments with any acceptable accuracy is an entirely different matter.
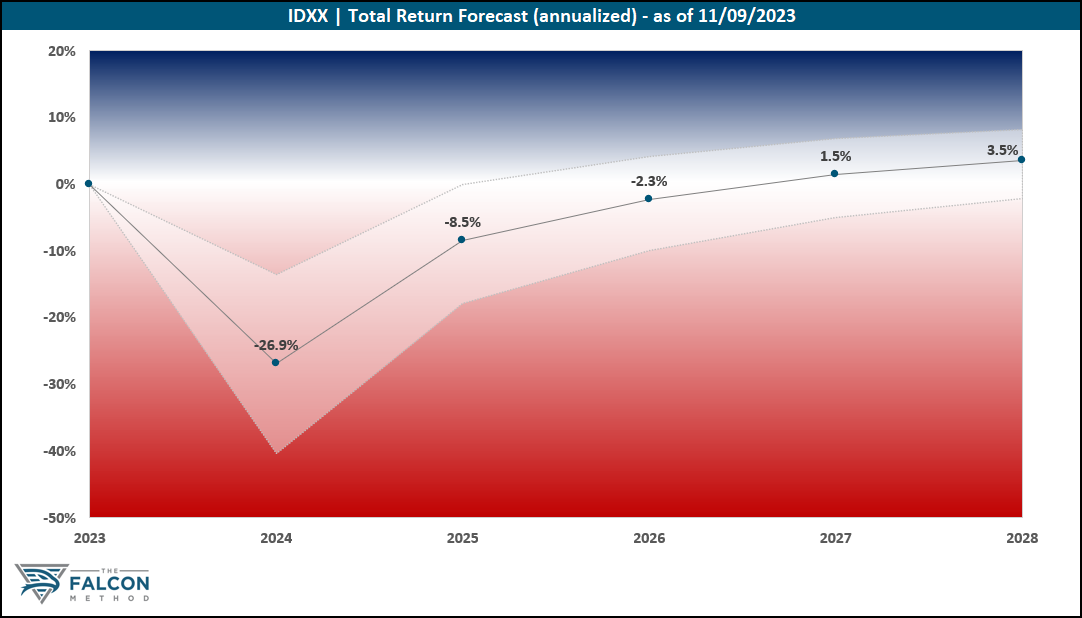
Naturally, this begs the question: how do we address this issue at the FALCON Method? Frankly, assessing competitive dynamics is the most challenging aspect of qualitative analysis, yet it has the largest impact on future returns, so we cannot afford to surrender without giving our best shot. You may notice that most companies within our global EVA Monster universe have developed such wide moats that they are visible from the Moon. With these businesses, we are not speculating on future winners but instead bet on those that have already won in their respective fields when the market offers us decent odds. (We measure the latter by the stock’s five-year total return potential modeled in our EVA-based analysis framework under two fundamental scenarios.)
What could go wrong?
As expected, we are actively looking for comments from management teams on how they plan to further widen the moat. This is in perfect sync with what Warren Buffett said at Berkshire’s 2000 annual shareholder meeting: “So we think in terms of that moat and the ability to keep its width and its impossibility of being crossed as the primary criterion of a great business. And we tell our managers we want the moat widened every year. That doesn’t necessarily mean the profit will be more this year than it was last year because it won’t be sometimes. However, if the moat is widened every year, the business will do very well. When we see a moat that’s tenuous in any way — it’s just too risky. We don’t know how to evaluate that. And, therefore, we leave it alone. We think that all of our businesses — or virtually all of our businesses — have pretty darned good moats.”
That said, if an exceptional EVA Monster company can only defend (yet fails to widen) its already great moat, and supportive megatrends remain at work, plenty of value-creating growth and shareholder returns are to be expected. So, there’s nothing wrong with this scenario either, which makes us focus much harder on identifying the deterioration in moat characteristics. This is exactly why the “What could go wrong?” section found its way into every analysis you can read in the FALCON Method Newsletter. Alongside identifying tail risks that could possibly destroy the moat, our model’s pessimistic scenario tends to assume increased competition to reflect a negative moat trend.
Developing moats
Indeed, some companies under our coverage seem to have narrower moats, but we’d assign a positive rating to their competitive dynamics. These names make it into our EVA Monster universe, but we tend to be more conservative with our entry prices and position sizing. With these “lower-tier targets,” we may scale in near the bottom of our accumulation range or outright wait for the price to fall below our “take full position” level. Evolution AB comes to mind, with which we didn’t pull the trigger until the annualized total return potential reached 20%. Even our pessimistic scenario gives us a ~14% annualized return from our entry price. There’s plenty of built-in margin of safety, yet Evolution is not the kind of company we’d bet the farm on; that’s why the suggested 2-3% position size.
Reversing moat trends
Lastly, wide-moat companies hampered by negative trends are either excluded from our investable universe or, if identified later, they will not appear as top picks until the moat trend reverses. Also, their exclusion from the EVA Monster coverage is an ongoing discussion in our team. (T. Rowe Price, Alibaba, and PayPal come to mind.) On the contrary, Meta served as the perfect example of how a company can respond to challenges in a moat-enhancing way. Handling the Apple privacy issue with in-house machine learning solutions, fending off the emerging threat from TikTok, and actively preparing for the next wave of computing platform change all made the business more resilient. While the stock was punished, sub-$100 Meta was doing all the right things to defend and even strengthen its moat, which has been well rewarded by now. Again, competitive dynamics drive stock prices; it’s just not easy to measure and monitor them.
Skate to where the puck is going
Back to Vinall for a couple of thought-provoking observations: “Companies with wide moats are insulated to a considerable extent from competition, and this tends to make them less responsive to potential competitive threats. A wide-moat company is like a soccer team that only gets to play friendlies. Second, the problem with wide-moat businesses is that market shares are not up for grabs. The whole point of a wide moat is that market entry is exceedingly difficult. This, of course, has certain advantages, but the big disadvantage is that a great management has only limited opportunity to demonstrate its worth. When you have a company that can crush the competition, it is desirable to have a competition to, well, crush. Third, it strikes me that the best time to invest in businesses is before the moat is fully formed, provided, of course, there is sufficient evidence available that the moat will one day be formed. This is the period when the market’s reassessment of the company’s cash flow generating ability will be most dramatic.”
It would be hard not to agree on this last point, yet the “how to” part needs much more elaboration. After all, even Vinall managed to misread a developing moat situation and invested a considerable percentage of his fund in a company that got to the brink of bankruptcy. So, while everyone wants to be like Gretzky and skate to where the puck is going, it’s easier said than done. Getting to know industries better and widening your circle of competence can improve your ability to identify moat trends. When Charlie Munger was once asked how he would teach a college course on finance, he said he would have 100 different case studies on why businesses have succeeded and failed in the past. As investors, we must never lose our sense of paranoia and always be on the lookout for what could go wrong with the companies we analyze. Our job is far from glamorous, yet we should stick to our rigorous research process despite all the panic or hype in the market.
Want to learn more about our stock ranking methodology and evidence-based investment approach? Start with this blog post!
Or read more like this in the Beyond Dividends book.