Having a steadily rising dividend attracts investors and builds trust in the company.
Shareholders tend to interpret increasing dividends as a sign of strong financial health.
Most of them think, “As long as the dividend is growing, everything must be okay.”
This is PLAIN WRONG! Let me show you why…
Confessions first: I used to be a devoted dividend investor. So much so that I wrote a book on the topic which sold 10,000+ copies and became a best-seller in my country.
By teaching dividend investing in both personal and online formats (since 2014) and investing all my money in dividend stocks, my understanding got deeper and deeper… and this started to cause some inner conflicts around 2020.
By then, I had firsthand experience that income-focused investing is a suboptimal strategy when it comes to maximizing one’s future purchasing power. I wholeheartedly agree with Warren Buffett’s simple definition, which says:
“Investing is forgoing consumption now in order to have the ability to consume more at a later date.”
Dividend investing has some undeniable handicaps that make it virtually impossible for the followers of this approach to maximize their total return and thus their ability to consume much more at a later date.
Don’t get me wrong! As long as you only want reliable income and are willing to sacrifice a (considerable) slice of your future purchasing power for this reason, income investing can serve you well. I’d like to show you the factual reasons that gave me a new perspective on dividend investing.
We all have the tendency to search for and favor information that confirms or supports our prior beliefs, and we tend to disregard the info that contradicts our beliefs and values. (This is called confirmation bias.)
I know all too well that reading stuff that questions how you were investing up to this point is very uncomfortable.
Been there, done that… as a best-selling author. That said, if you remain open to what I’m going to share about the importance of the companies’ capital allocation and the proven drivers of shareholder value, you can become a better investor.
All I ask you is to put your beliefs aside while reading this piece and objectively evaluate the findings supported by evidence and real-life examples. This is exactly how I became a more accomplished investor…
The dividend promise is a trap
Paying a dividend is a choice made by the management about how best to manage the owners’ cash. (Yes, being a shareholder means that you ARE an owner!)
The dividend is just one option to use that money, as you can see below.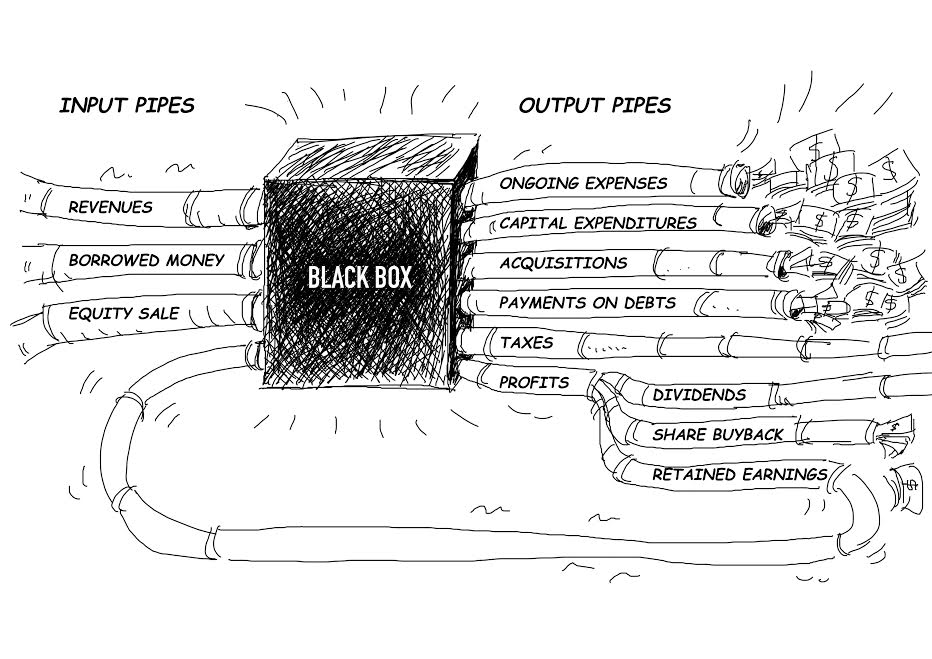
A good dividend is one that’s paid out with money the CEO cannot efficiently allocate to growth. What does this mean?
As long as the management can find opportunities to put the money to work and earn a return on this newly invested capital that surpasses the cost of this capital (more on this later), paying a dividend is not the best choice they can make.
Income investors typically don’t think this way. They tend to favor those companies which have been paying dividends for a long time, without interruption and reduction.
Such a policy seems to all but guarantee a reliable and growing passive income stream; this is why the Dividend Champions (firms with 25+ years of consecutive dividend increases) are so widely-followed and acclaimed. However, there is no free lunch…
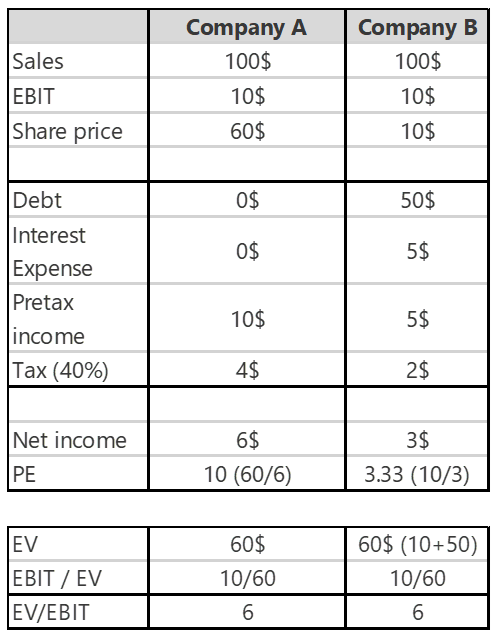
Look at the following example:
Capitalism is cruel, but it works!
What do you think happens to companies that turn down such investment opportunities for short-term benefits? They get hit hard by competitors whose capital allocation is not shackled by the “unbreakable dividend promise.”
As Danielle Town writes in her book (entitled Invested):
“Having a steadily rising dividend […] puts the company into what is essentially an implied contract of expectations between the company and its shareholders that, once entered, the company can never breach: a Dividend Contract of Expectations. The agreement in a Dividend Contract of Expectations is that the company will continually pay an increasing dividend, and shareholders will interpret that payment as a sign of the company’s strong financial health.”
The unbreakable promise of ever-increasing dividends makes reasonable capital allocation very difficult, if not impossible.
The point I’d like to make is this:
Dividends, particularly large, steady dividends, are to be viewed as if you were the business owner who wants the best possible return on their investments.
It shouldn’t matter whether the money is coming from dividends or such highly value-adding growth projects that only exceptional companies can pursue. (More on this later.)
Capital allocation matters! Where are the dividend darlings?
If you want to become a better investor, reading William Thorndike’s “The Outsiders” book would be an excellent investment of your time. Thorndike examines eight CEOs who created enormous value for their shareholders by excelling at capital allocation.
The conclusion may be troubling to devoted dividend investors who are not open to revisiting their approach:
“Each [of the CEOs profiled in the book] ran a highly decentralized organization; made at least one very large acquisition; developed unusual, cash flow–based metrics; and bought back a significant amount of stock. None paid meaningful dividends or provided Wall Street guidance. All received the same combination of derision, wonder, and skepticism from their peers and the business press. All also enjoyed eye-popping, credulity-straining performance over very long tenures (twenty-plus years on average).”
All the extraordinary capital allocators followed a virtually identical blueprint: they disdained dividends.
Wait a minute! Where did those eye-popping shareholder returns come from then?
When you hold a stock, you can make money from two sources: the price can go up, and you can collect dividends. There is no other way!
To take it a step further, we can break up the stock appreciation part into two components: earnings growth and price-to-earnings (valuation) expansion/contraction.
(I would rather use EVA, which stands for Economic Value Added, instead of earnings, and forget the highly popular PE multiple altogether, as you can read in this article.)
However, let’s stick with the widely-known metrics for now, to make things easier to understand. The comprehensive total-return formula looks like this:
Total return = Earnings growth + price to earnings expansion + dividends
It goes without saying that the higher the dividend yield, the less the other engines of total return must work. Dividend investors love high-yielding stocks!
Let me invite you to a thought experiment…
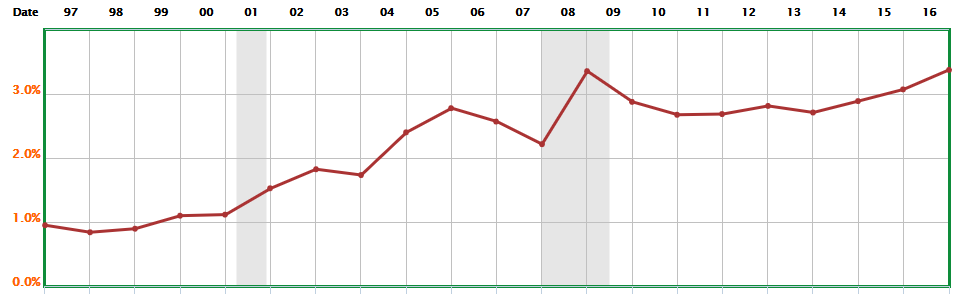
Say the treasury rates are at ~2%, and the S&P 500’s dividend yield is below 1.5%. (None of these are mouthwatering figures for income investors, and this is not science fiction… we’ve seen this movie!)
Let’s say that MakeYouRich Inc. is paying a hefty 7% dividend yield in this kind of environment. Why do you think the market prices this stock in a way that its dividend yield (the forward 12-month dividend divided by the stock price) can be this high?
There are two usual reasons:
(1) The current dividend is not sustainable because the company doesn’t make enough cash to cover it in the long run, or…
(2) The business has hardly any growth opportunities, so you will most likely not earn any more than the dividend.
Neither of these reasonable scenarios is too attractive for thoughtful investors who see the whole picture instead of focusing only on the dividend part of the total return formula.
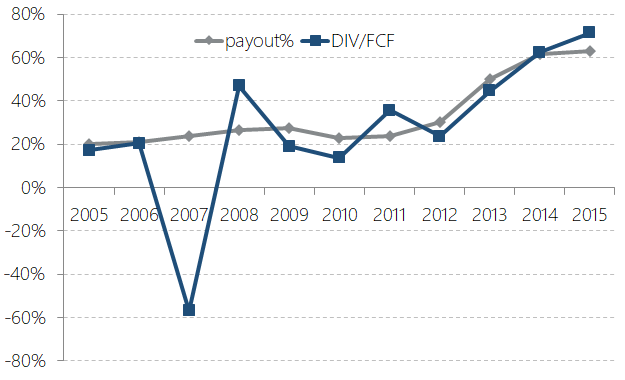
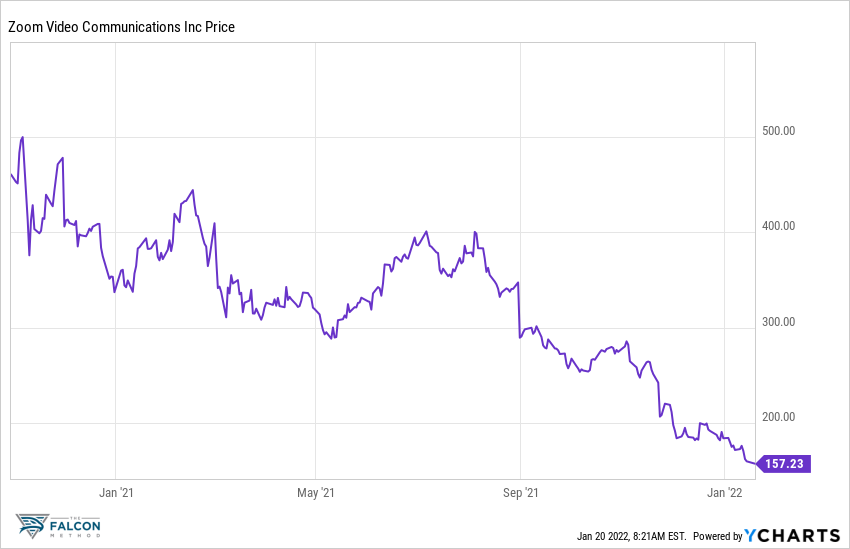
See what happens when a dividend darling breaks its promise!

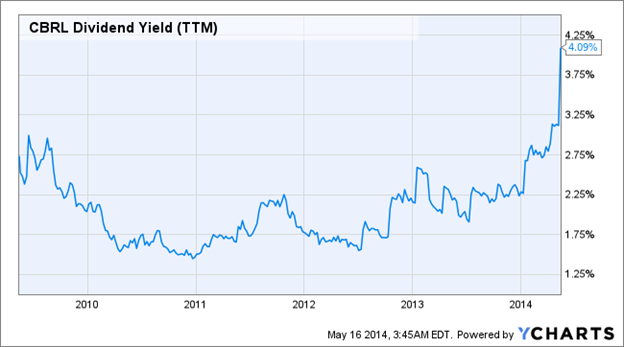
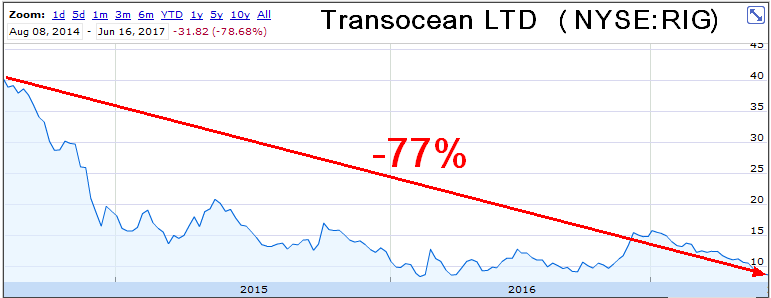
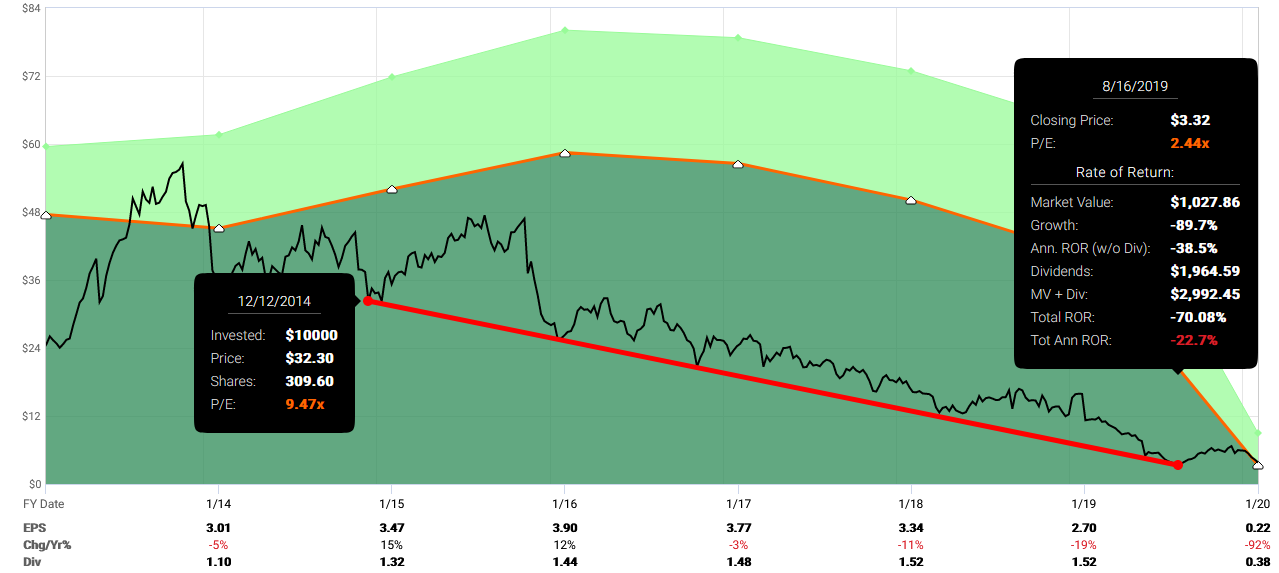
Kinder Morgan (KMI) was a high-yielder, one of the income investors’ darlings. (Disclosure: I was one of them at that time.)
The company boasted that it was the only name on the Fortune 500 list that provided guidance on its dividend. Too bad that the dividend was not sustainable, and investors who relied on that income lost their faith and dumped the stock once it became clear.
As the 75% dividend cut was announced, the stock price fell from $40+ to the low-teens. The phrase “getting Kindered” was born, meaning that someone suffers a significant dividend cut and the ensuing loss of capital.
Believe me; you never want to get Kindered! I learned this the hard way…
Here’s how you could invest more wisely
First and foremost, let go of your dividend fixation. It makes no difference whether a company pays a dividend as long as they are doing their best on the capital allocation front.
As a reminder:
Total return = Earnings growth + price to earnings expansion + dividends
Let’s focus on the earnings growth component now. I’ll show you how this part can fool investors as well, and then you’ll see the solution that works very well for me.
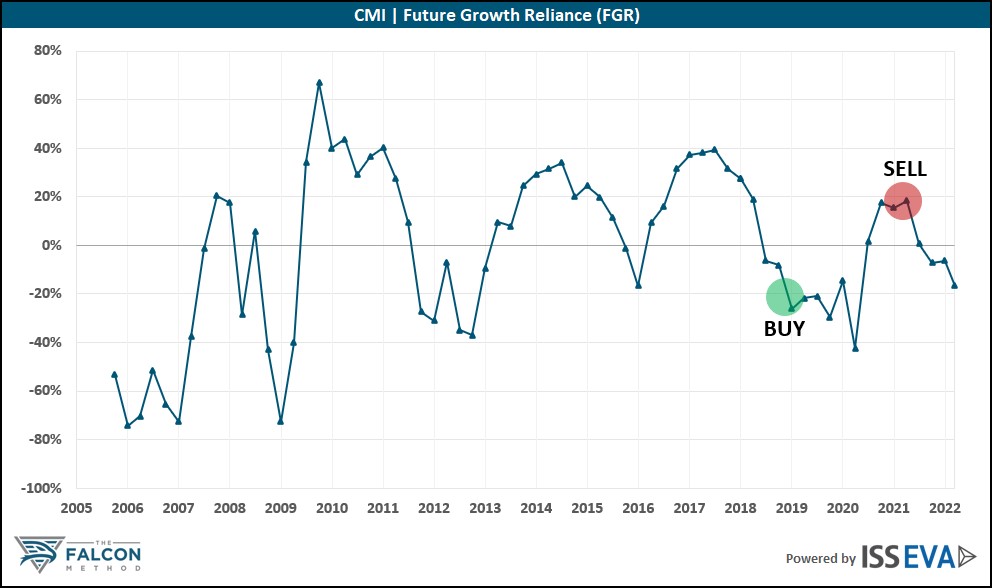
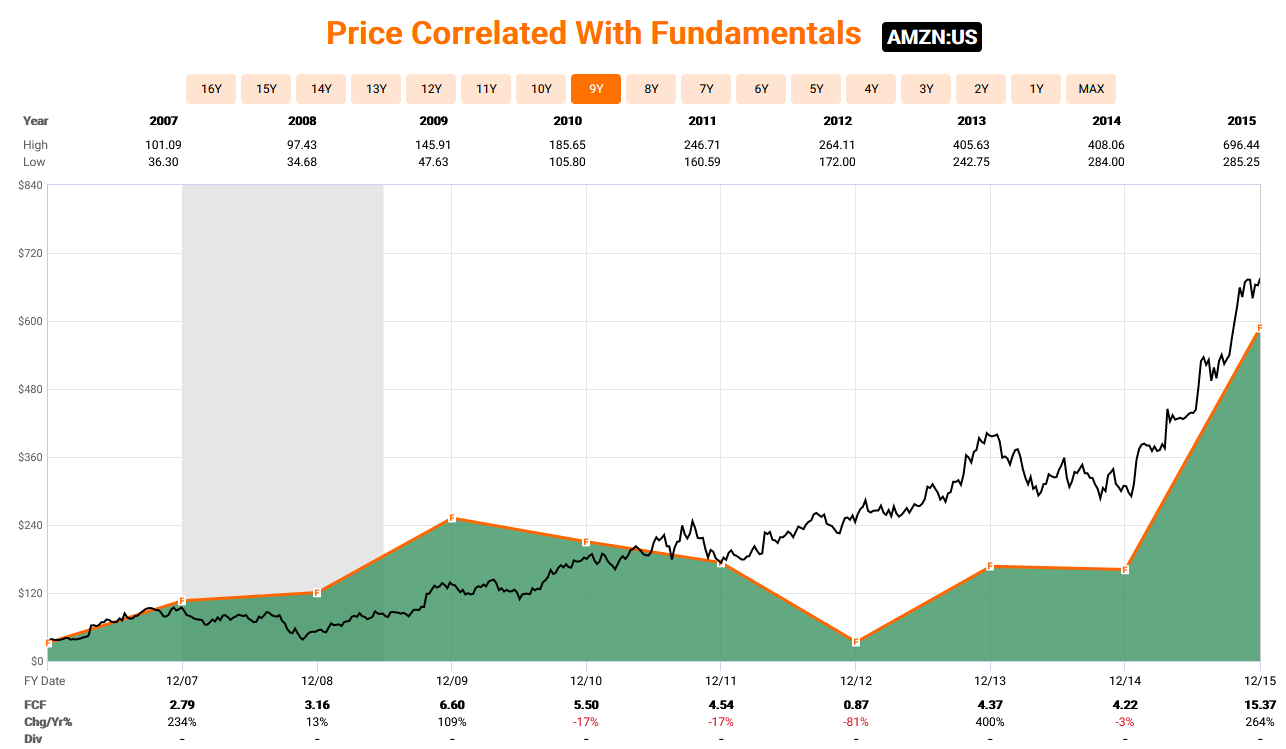
Take a look at Whirlpool between 2013 and 2019!
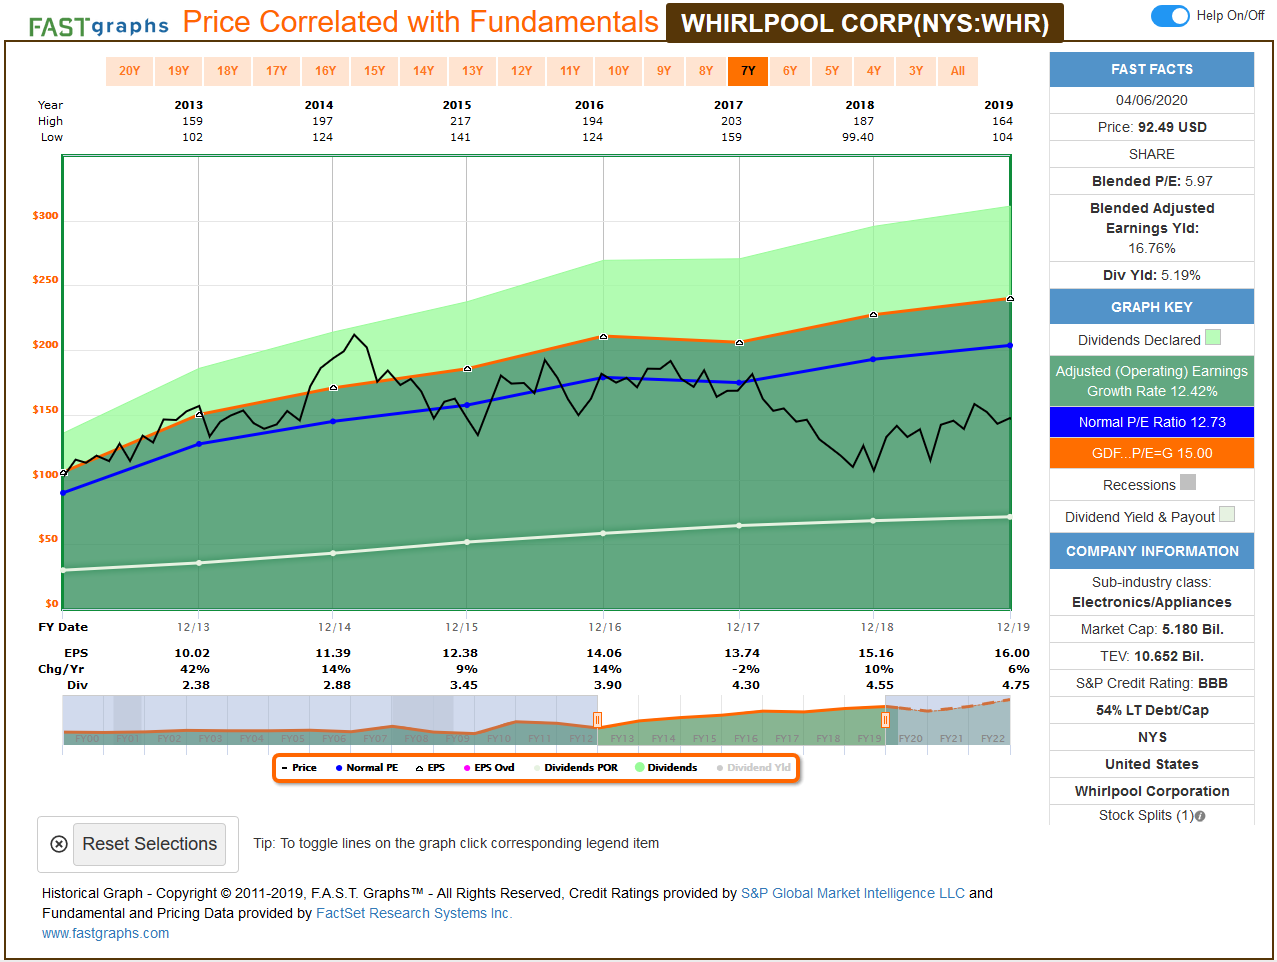
As you can see, earnings per share (the dark green area) shows a nice increase almost every year between 2013 and 2019 (from $10 to $16), yet the stock price (the black line) is moving sideways. So much for earnings growth affecting the price and shareholders’ returns, you might say…
Until you see this next picture:
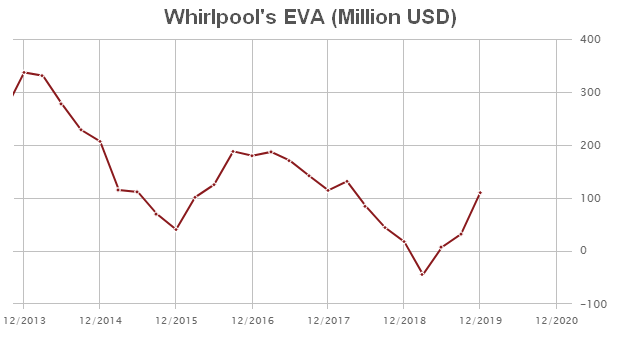
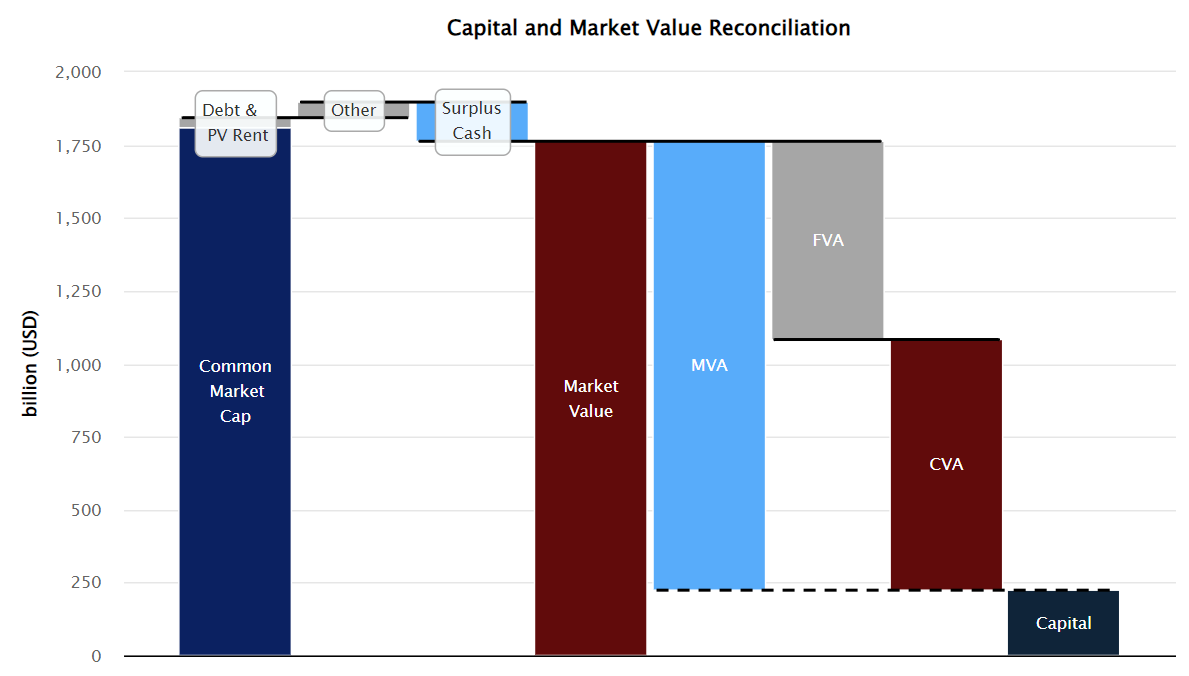
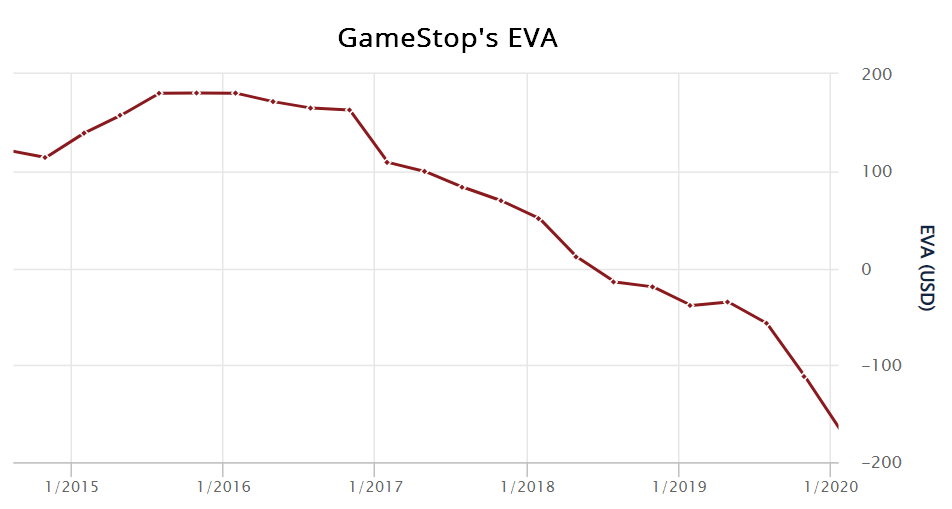
Simply put, EVA is the company’s real profit after correcting for all accounting distortions and applying the true cost of capital to all the money used by the business. (Read my explanation of EVA here.)
While EPS exhibited growth, the increase in EVA (real value creation) was not that clear, to say the least. This is a classic example of where EVA and EPS differ, and EVA wins the argument.
While growth in the widely-followed EPS (earnings per share) metric doesn’t essentially result in a growing stock price, EVA (Economic Value Added), which is an institutional-level metric, remedies most of the problems and thus comes pretty close to being a perfect indicator for long-term investors with a business owner mentality.
I’m not the one who invented EVA, so instead of talking it up, even more, I’ll let the numbers do the talking.
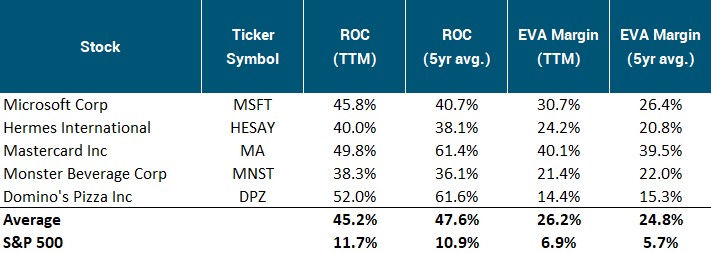
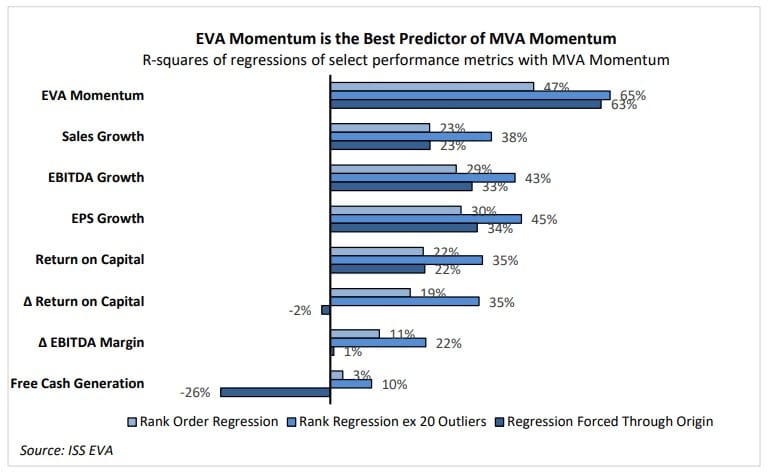
Bennett Stewart writes in his “Best-Practice EVA” book that running the correlation across all stocks, it is about 82 percent, meaning that EVA and expectations about future EVA generation drive shareholder returns. That said, I came across a white paper later, which revealed an even stronger relationship between the EVA-based shareholder return predictions and the actual shareholder returns. (TSR stands for Total Shareholder Return in the chart below.)
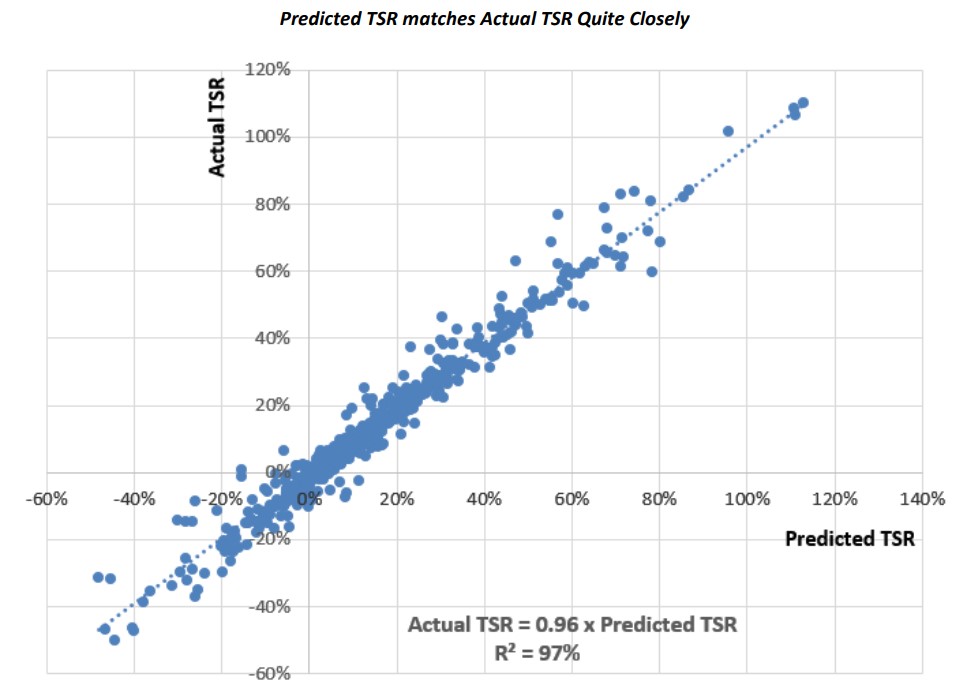 Source: The Link Between TSR and EVA, Bennett Stewart
When it comes to the growth component of the total return formula, there’s no question that we really should focus on EVA growth.
That said, EVA grows when the company invests its incremental capital at a rate that surpasses the cost of that capital. So EVA essentially grows as a result of wise capital allocation. All roads lead to Rome… to the same conclusion, I mean.
Want to dip your toe in? I’ll show you my journey
I’d like to make it clear that my transformation from a dividend investor to an all-round quality-growth investor took years. Btw. I seem to be no exception, as reading Fundsmith founder Terry Smith’s “Investing for Growth” book would reveal to you that even this star money manager re-evaluated the role and importance of dividends as the years went by.
There’s absolutely no problem with starting out by investing in reliable dividend payers! BUT you should keep track of where your returns are coming from…
AT&T vs. Lowe’s: 2 Dividend Champions in totally different leagues!
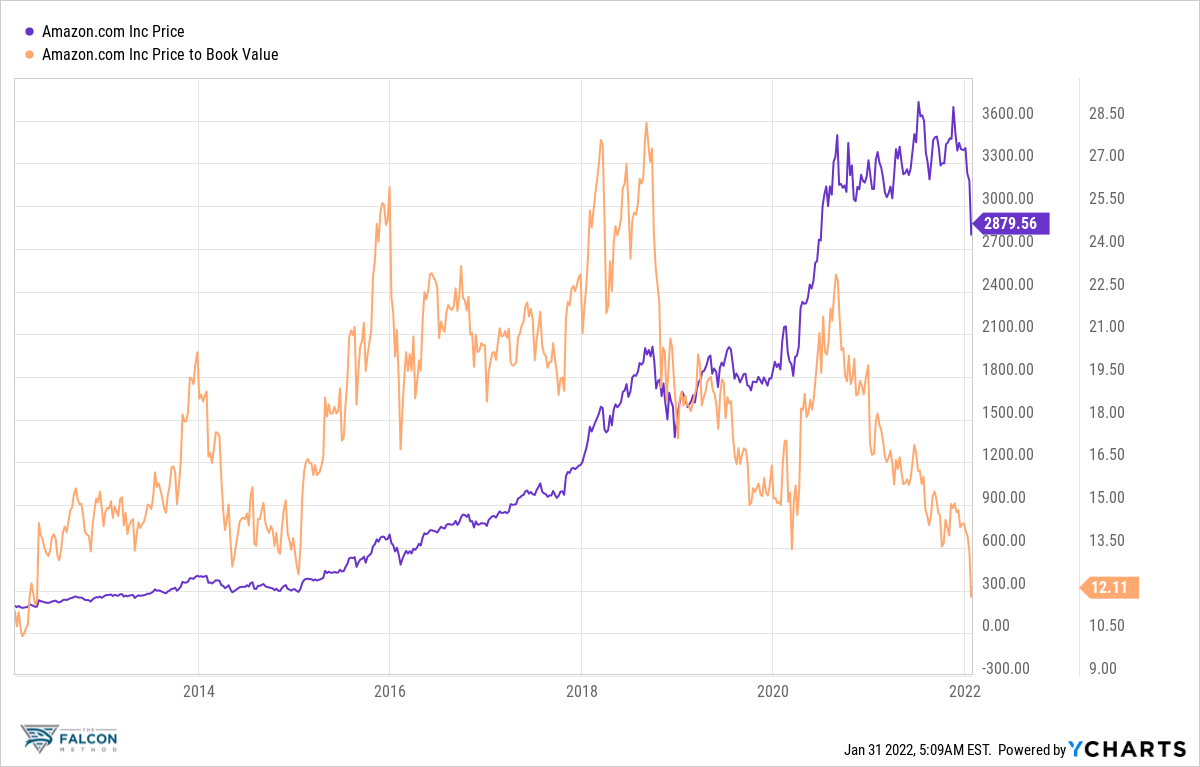
AT&T used to be the darling of dividend investors as its name became synonymous with “high dividend yield, delivered reliably.” Lowe’s, on the other hand, has a 50+ year streak of dividend increases, but its stock almost always qualified as a low-yielder. See how investing in these two names for 10 years could work out.
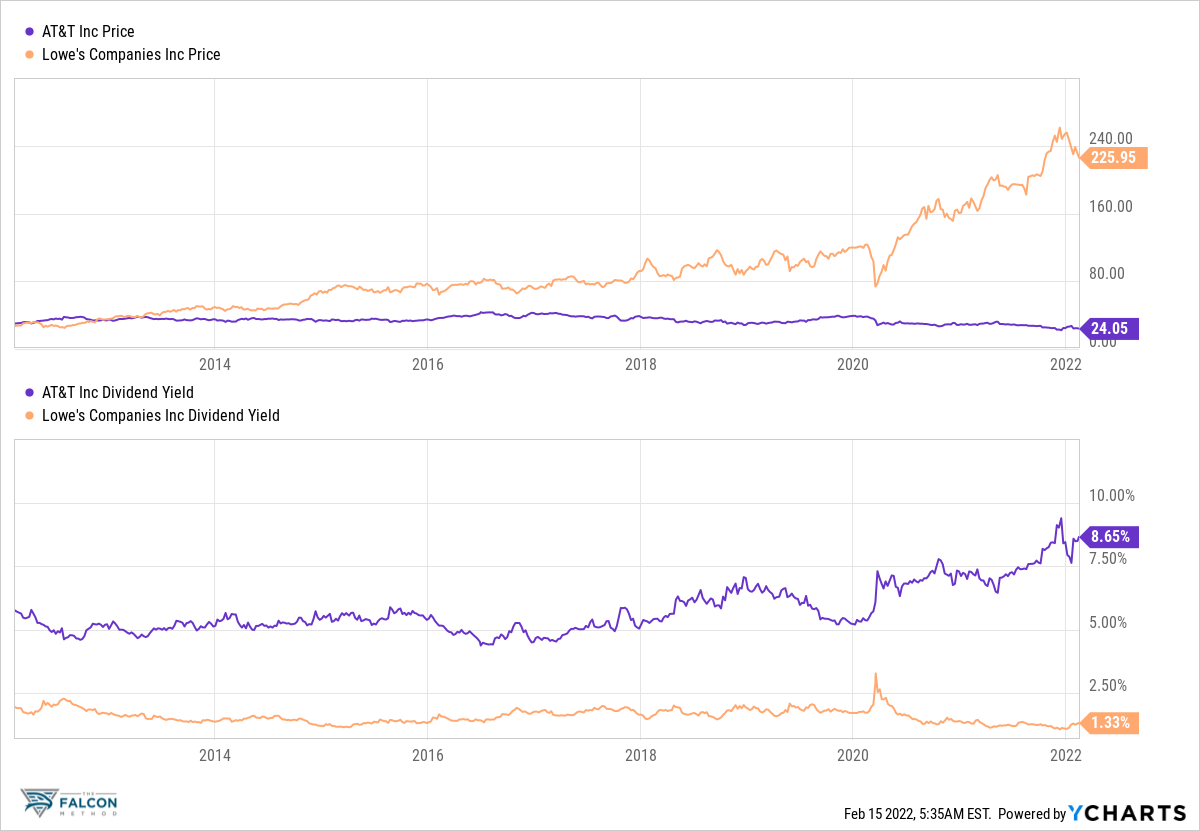
While high-yielding AT&T’s price barely moved (at least not in the right direction), Lowe’s price chart shows a nice and steady increase. You can see the explanation below…
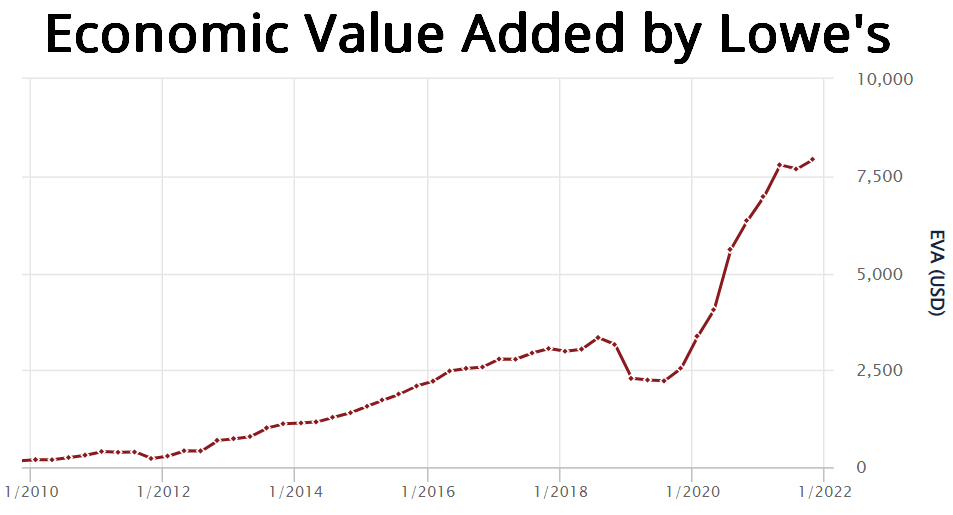

While Lowe’s is firing on all cylinders and is producing more and more EVA, AT&T’s EVA was going sideways (or down) most of the time within the 10 years. Wherever EVA goes, the stock price follows as you saw the quantitative proof.
AT&T’s shiny yield was not worth tying down your capital, but as long as you keep a record of the underlying factors of total return, you could learn a valuable lesson: the dividend is not everything; thoughtful investors must also focus on where the company’s real economic profit (EVA) is going.
Noticing this, any dividend investor can take the necessary steps to become more successful. Now let me call on Charlie Munger to highlight the most important message that every long-term investor must print out and keep in mind.
It’s the quality that really matters!
Munger said: “Over the long term, it’s hard for a stock to earn a much better return that the business which underlies it earns. If the business earns 6 percent on capital over 40 years and you hold it for that 40 years, you’re not going to make much different than a 6 percent return – even if you originally buy it at a huge discount. Conversely, if a business earns 18 percent on capital over 20 or 30 years, even if you pay an expensive looking price, you’ll end up with one hell of a result.”
The message is clear:
In the long run, it’s the business quality that drives returns, not the valuation you pay!
I hope you wanted to ask, “what about the third and last component of our total return formula, the valuation multiple?”
Let me show you an example to highlight that this sentiment-driven component is only relevant in the short term.
Over 10+ years, the investment performance is determined by the rate of return at which the company can employ its capital and the firm’s reinvestment opportunities.
AN EYE OPENING MATH EXAMPLE:
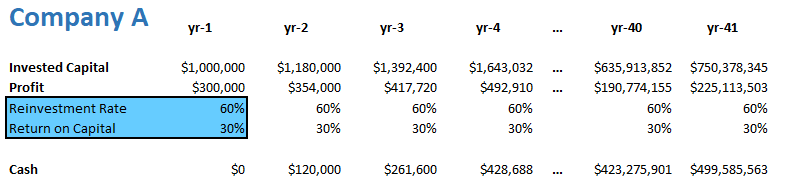
Company A can make a 30% return on all the capital it employs (this is its ROC, which stands for Return on Capital) and can reinvest 60% of its profits every year (this is the reinvestment rate).
If this company starts with $1M capital, it will produce $300K in profit by the end of the first year. $180K of this profit gets reinvested while the remaining $120K lands in the cash coffers. Here is how the math would look over a 40+ year timeframe:
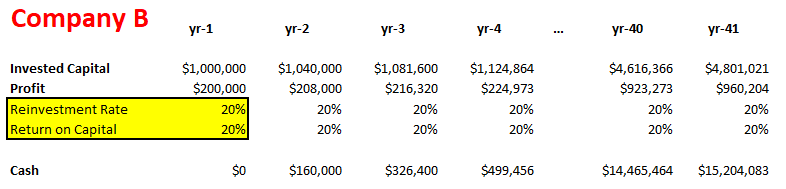
Company B operates with a 20% ROC and a 20% reinvestment rate, so the math would work in the following way:
Let’s assume first that the market is valuing both firms at 20-times earnings, and this multiple stays constant over the whole 40+ years. (I know this is an unrealistic assumption, but bear with me, as I’d like to point out a very important thing before we introduce the changes of the valuation multiple.)
The Enterprise Value is simply the sum of the equity value (20-times profits) plus the amount of surplus cash. Here is how things would work out:
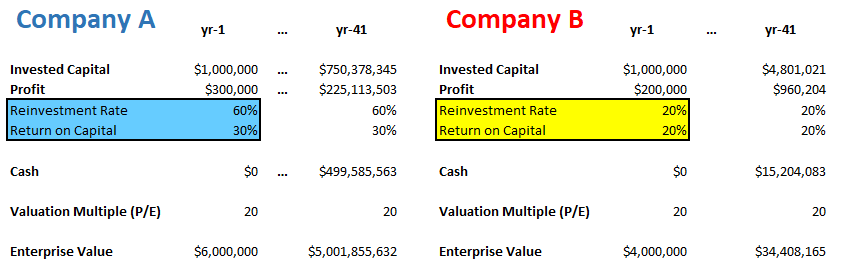
Investing in Company A for 40+ years would give you an annualized return of 18.3%, while your return with Company B would be 5.5%. (This is simply the compound annual growth rate between the starting and ending Enterprise Values.)
It is quite telling how, by every passing year, these annualized return figures converge toward the level that multiplying the ROC by the reinvestment rate would give you. (In the A case: 60% x 30% = 18%; in the B case: 20% x 20% = 4%.)
This is essentially the math behind Charlie Munger’s quote, although he used a 100% reinvestment rate to illustrate his point more simply. (But no company operates with a 100% reinvestment rate, so our example is more realistic.)
Now on to the part that the valuation multiple can play in determining your investment returns.
Let’s assume that you invested in Company A’s stock at a hefty valuation of 20-times earnings and that multiple contracted to 8 by the end of the 40+ years. Your annualized return would still come in at 16%, despite the heavy valuation headwind.
On the other hand, if you managed to buy Company B’s stock on the cheap, at 8-times earnings, and that multiple grew to 20 by the end of the 40+ years, your annualized return would still only hit 8%.
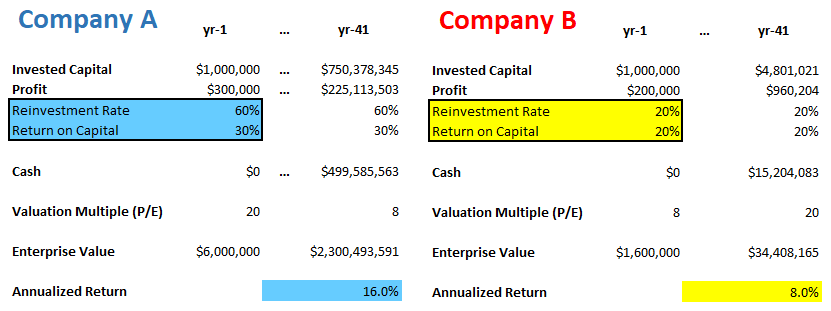
Conclusion: it is the profitability of the business (ROC) and its growth prospects (the reinvestment rate) that drive returns on a multi-decade-long horizon. This is not fiction but pure math.
I will let the numbers do the talking…
It’s funny to see that several people call themselves long-term investors, yet most of them keep asking the wrong question: “Is that stock cheap?” instead of the correct one: “Is the underlying business of exceptional quality?”
As Joel Greenblatt teaches at Columbia Business School’s Value Investing courses (which I completed), once you find a stock that looks undervalued, it usually takes 2-3 years for the valuation multiple to revert to its mean if you were right about the company’s fundamentals.
Once the valuation multiple expansion has happened, that coiled spring effect is gone: that component of the total return formula won’t keep working for you… so you would have to make do with the EVA growth and dividend components.
Basically, as Munger says, you would earn what the business earns on its capital. How do you think the revered Dividend Champions fare in this regard?
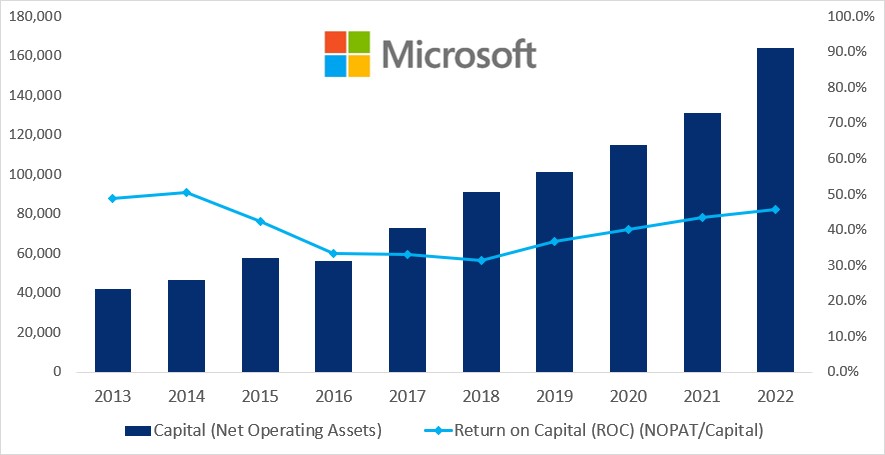
The 3-year average ROC (return on capital) numbers of 141 Dividend Champions have a median of around 10% and a mean below 13%. Do you want a benchmark? How about using the universe of quality-growth stocks (we like to call EVA Monsters at the FALCON Method)?
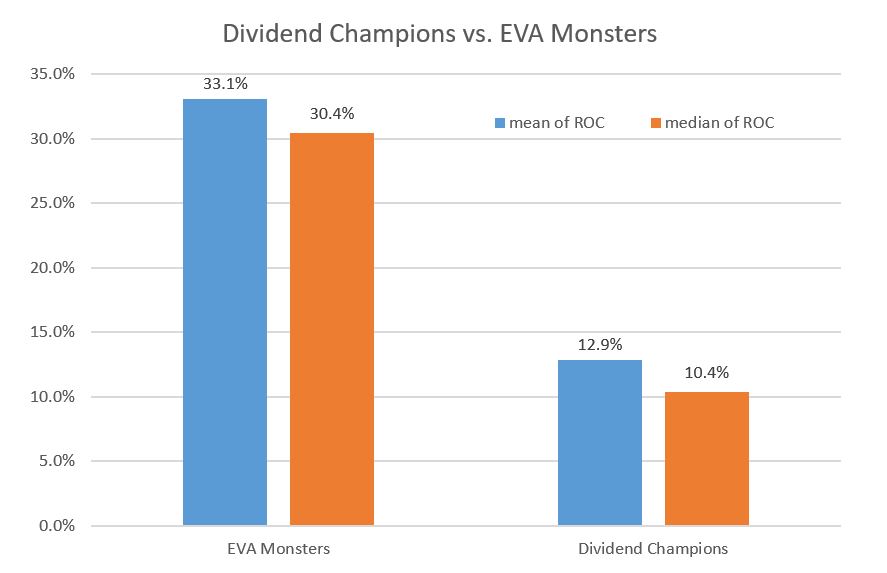
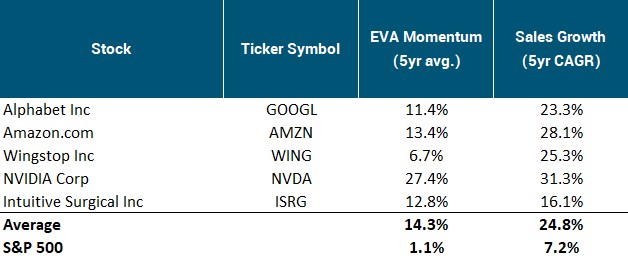
Most Dividend Champions are not in the same league as the quality-growth beasts. Here are some names and ROC numbers from the latter group to illustrate this point:
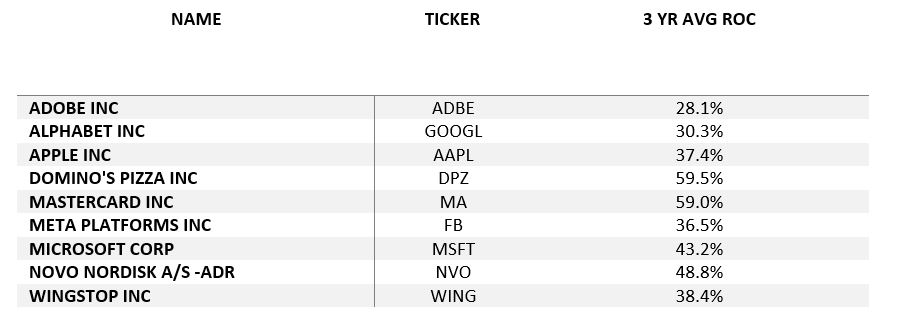
Not to mention that the companies in our carefully selected global EVA Monster universe (there are ~50 at the moment) have far better and more reinvestment opportunities than most of the Dividend Champions.
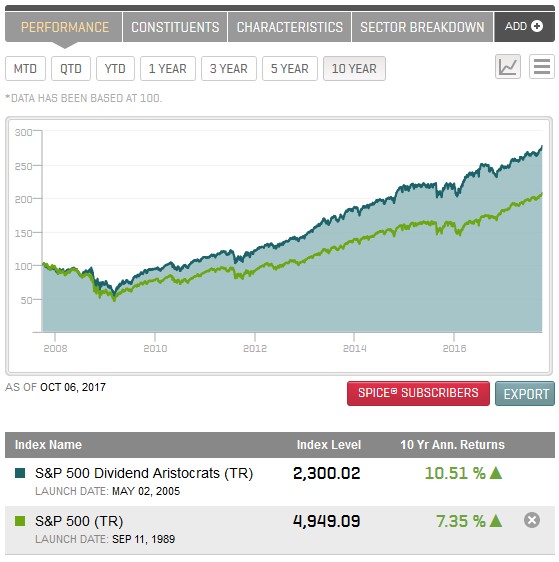
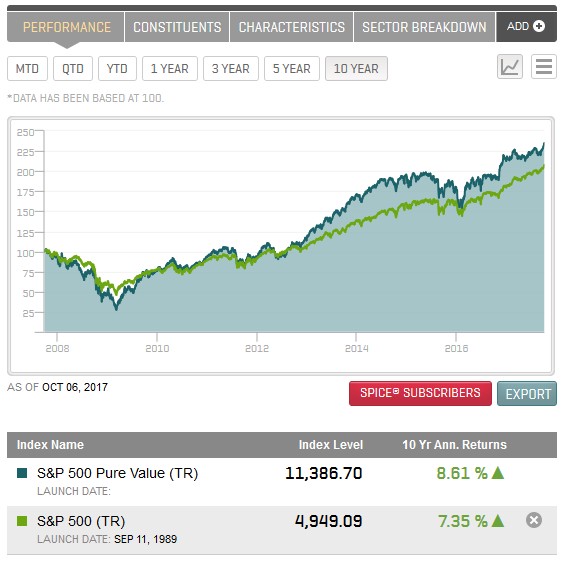
If you combine the higher return on capital and the higher reinvestment rates, you must realize that holding a quality-growth company for the long run offers much more attractive total return potential than the beloved Dividend Aristocrats.
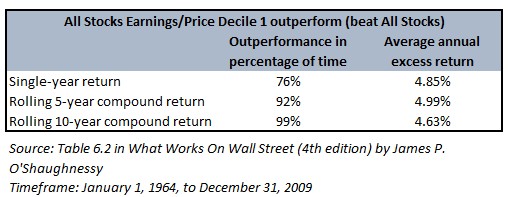
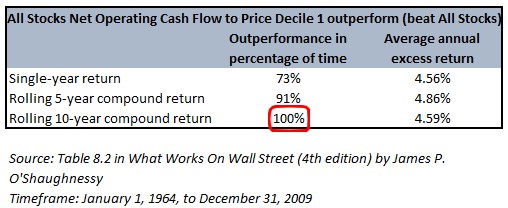
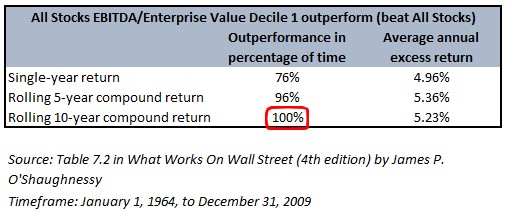
In fact, numbers do the talking…
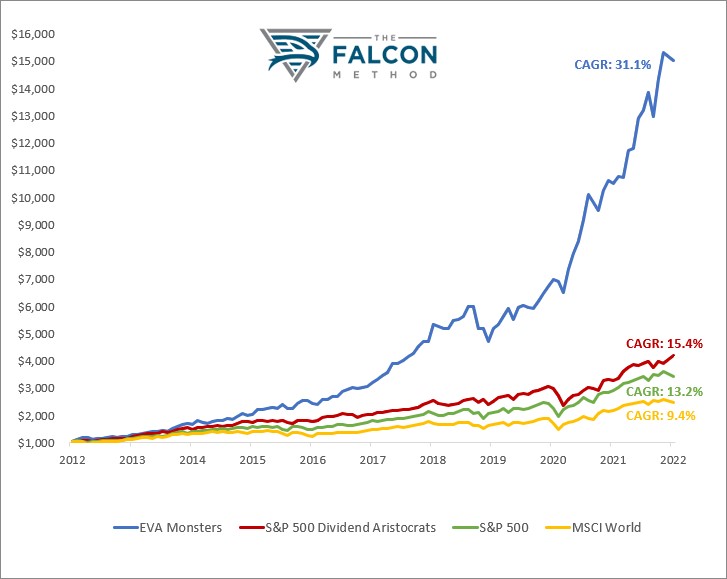
From this perspective, dividend investing is far from the “single best strategy” many want you to believe.
The sweet spot, which makes your start (or transformation) easier
Let me reward those few who are still with me with a piece of great news: There are some reliable dividend payers who also qualify as EVA Monsters, so they can be great investments from both an income and total return perspective.
While the full list of such stocks is reserved for the FALCON Method newsletter subscribers, BlackRock (BLK), Lowe’s (LOW), and Microsoft (MSFT) come to mind as great examples.
The existence of such companies means that dividend investors can dip their toes into the quality-growth investing realm without sacrificing their dividend checks.
If you prefer to take this route, I kindly ask you to keep track of these EVA Monster positions in your portfolio and evaluate their performance separately, compared to the other parts of your portfolio after ~5 years. My bet is that you’ll be converted much sooner than that…
Once you see the results, you’ll have firsthand experience and thus won’t discard the notion that dividends are not needed for stellar returns as long as you know how to spot the exceptional quality-growth names in the market.
This was a life-changing realization for me (that took way too long, in hindsight)! Hopefully, I could help speed up the process in your case and thus increase your lifetime investment returns.
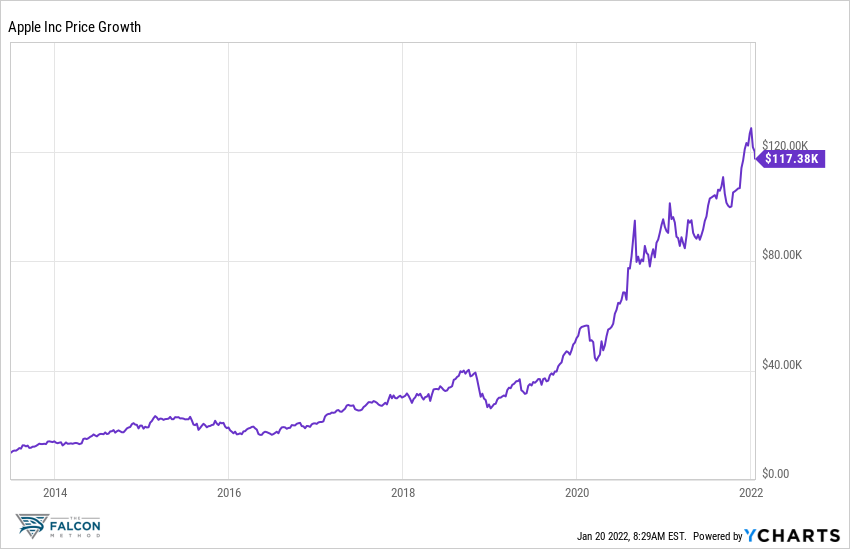
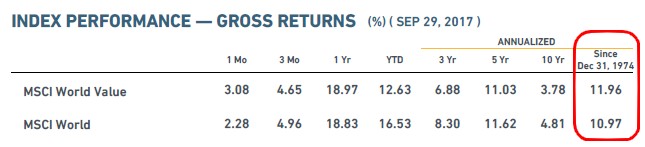
Quality never goes out of style… Look at this impressive combination!
If you are a long-term investor, the following chart should both be thought-provoking and mouthwatering to you.
The chart shows the excess returns of the MSCI World Quality Index, which is the amount by which this Quality Index beats the core MSCI World Index.
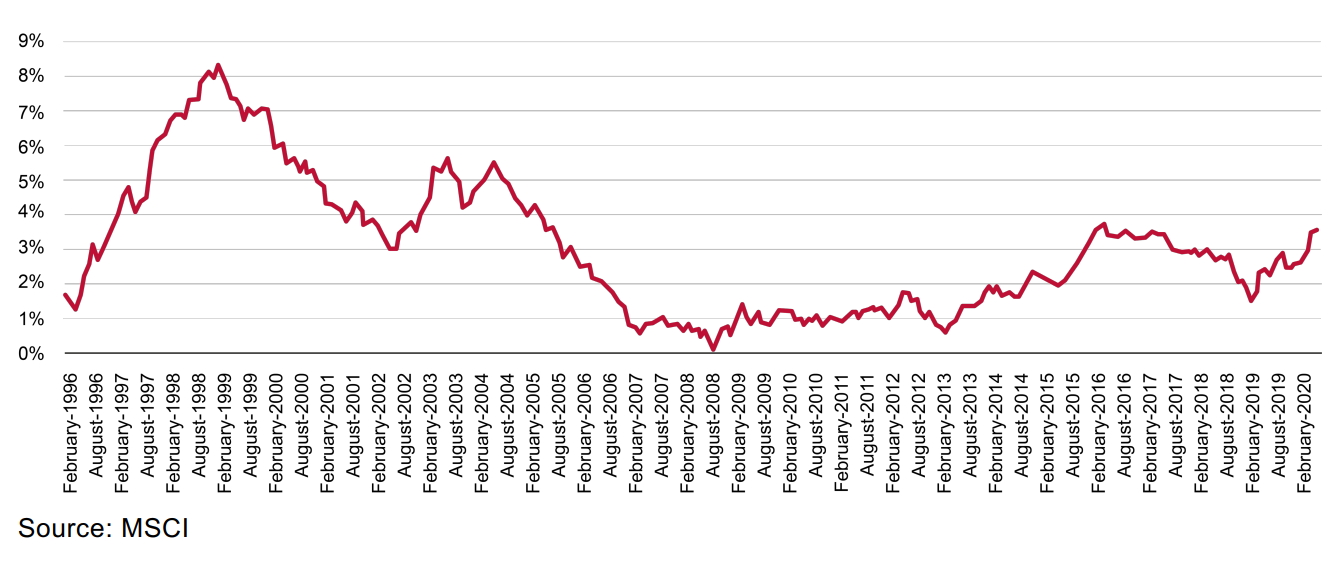
Let me translate: Over the last 25 years, there has never been a rolling 120-month (ten-year) period when quality has not performed as well as or better than the MSCI World Index.
Now that you know the underlying logic (that ROC and reinvestment rate drive long-term returns) and see the proof that this quality-focused approach is indeed working, what reasons do you have to stick with mediocre dividend payers?
Add to the mix that top-quality businesses can better withstand inflation as they have the ability to price their highly desirable products, services, and assets to preserve their profitability in an inflationary environment.
In his 2021 annual letter to investors, Fundsmith’s Terry Smith also emphasized that “the initial impact of input cost inflation is not on consumer prices but on company profits. All companies are not equal in this regard.”
You can check the math below with a real-life example…
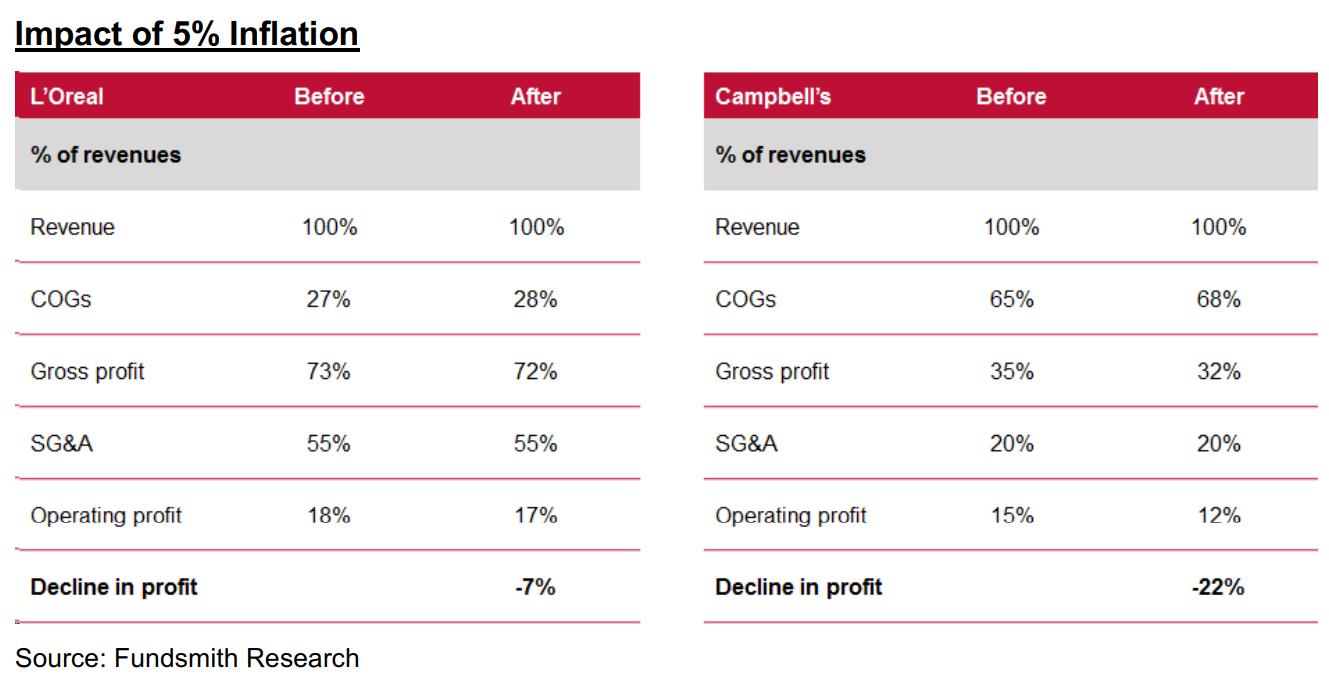
The conclusion is clear: from a fundamental respect, quality companies are likely to be better able to weather inflation. One more reason (besides the proven outperformance), and I’m not finished yet.
Last but not least, holding shares of exceptional businesses for decades can give you peace of mind that no other investment strategy could match!
Remember: when you hold stocks in mediocre companies, you really should get rid of them every 2-3 years once the valuation expansion has happened. As Josh Tarasoff says, “I was noticing that investors are typically under intense time pressure to find new ideas.
The math is simple: a portfolio with two dozen stocks and an average holding period of two years requires one new, market-beating idea each month, without end.
And this example involves a relatively concentrated and low-turnover portfolio by the standards of the industry: most investors need to keep up an even faster pace.
The necessity to be continuously on the verge of some great new idea sows an endemic hurriedness that can be seen on people’s faces and heard in their voices. This struck me as unhealthy for decision making (and perhaps even unhealthy, period).”
Owning the good stuff for decades is less stressful, provides higher returns, and is a great hedge against inflation.
This combination got me hooked once I understood all the underlying evidence.
And you don’t even need to completely give up the dividends since there is an intersection of the income-focused and quality-growth approaches, thanks to those dividend-paying EVA Monsters.
So what now?
While I keep holding some of my dividend stocks, most of my new capital goes into EVA Monster names these days.
My love affair with income investing is not totally over, but I am only willing to commit serious capital to a dividend stock when its total return potential looks competitive in comparison with the EVA Monsters. (This only happens when a “dividend darling” loses Mr. Market’s affection and temporarily lands in the bargain bin.)
At the FALCON Method, subscribers of our monthly newsletter service get the best of both worlds.
Whenever a reliable dividend payer’s stock gets marked down so much that its total return potential becomes attractive, we are pouncing on that opportunity; otherwise, our in-depth modeling of ~50 global EVA Monsters gives us a valuable ranking to focus our attention and money.
Ready to take the guesswork out of investing and get to the next level?
Join our free webinar and upgrade your stock selection process with cutting-edge cata!


 Check out the book on Amazon!