The core principle of value investing is almost 100 years old, yet it is totally unchanged: always invest with a margin of safety.
This means that the stock you are buying must be priced at a huge discount to the underlying company’s intrinsic value. The part of the concept that is constantly changing is how you come up with the intrinsic value of the business.
Today most investors use the income statement and the balance sheet to calculate the value of the business. Common multiples are easily accessible on different websites that give the impression of thoughtful analysis and comparison of companies.
But the truth is that since the income statement and the balance sheet are both flawed from an investor’s perspective, these multiples are misleading and dangerous.
Serious stock investors should STOP using these multiples and focus on the business’s true profitability. (That is not presented in the accounting reports.)
In this article, we will go through the most common valuation multiples to bust them one by one. And at the end, we give you a link to learn more about valuing companies based on their true value creation. Long-term focused investors should focus on that instead.
Let’s start…
One of the first multiples: P/BV
Back in Ben Graham’s time (who is often referred to as the father of value investing), just after a depression, a company’s intrinsic value was defined as its liquidation value. Investors used the balance sheet to carry out conservative calculations to determine what shareholders would get if all the assets were sold and all liabilities were paid.
This is how they did it: Net Current Asset Value (NCAV) equals the company’s current assets minus its total liabilities (including preferred stock). Once you divide this NCAV by the number of shares outstanding, you’ll have a pretty good idea of what dollar amount a share may be worth if the business were to be liquidated.
Paying a much lower price than this was an approach that worked like a charm for over 40 years since stock prices were generally quite tightly tied to book values, and patient investors could often find companies that were out of favor, trading below estimated liquidation value.
As Bill Nygren, portfolio manager at The Oakmark Funds points out, “It was an asset-heavy economy, which made it appropriate to value businesses based on their tangible assets. In fact, as recently as 1975, 83% of the stock market value of the average company was represented by its tangible book value.”
Okay, now fast forward to today…
A lot has changed since then. Today you’ll see a much more asset-light economy, where intangible assets (like brand names and patents) account for over 80% of the average company’s market value.
(Just think about the industrial era when factories equipped with heavy machinery appeared on the balance sheet, compared to the intangible value of brands and software algorithms that is “invisible” to investors today.)
As Nygren puts it, “The linkage between book value and business value has been broken because so many important assets today are intangibles and don’t even show up on the balance sheet. […] For companies in the S&P 500 today, the correlation between stock price and tangible book value has become quite small, just 14%. This is a very big change from 25 years ago when that correlation was 71%—or 5x stronger than it is now.”
Here’s what Warren Buffett had to say about this shift: “My own thinking has changed drastically from 35 years ago when I was taught to favor tangible assets and to shun businesses whose value depended largely on economic goodwill.” Times are changing, don’t fall behind!
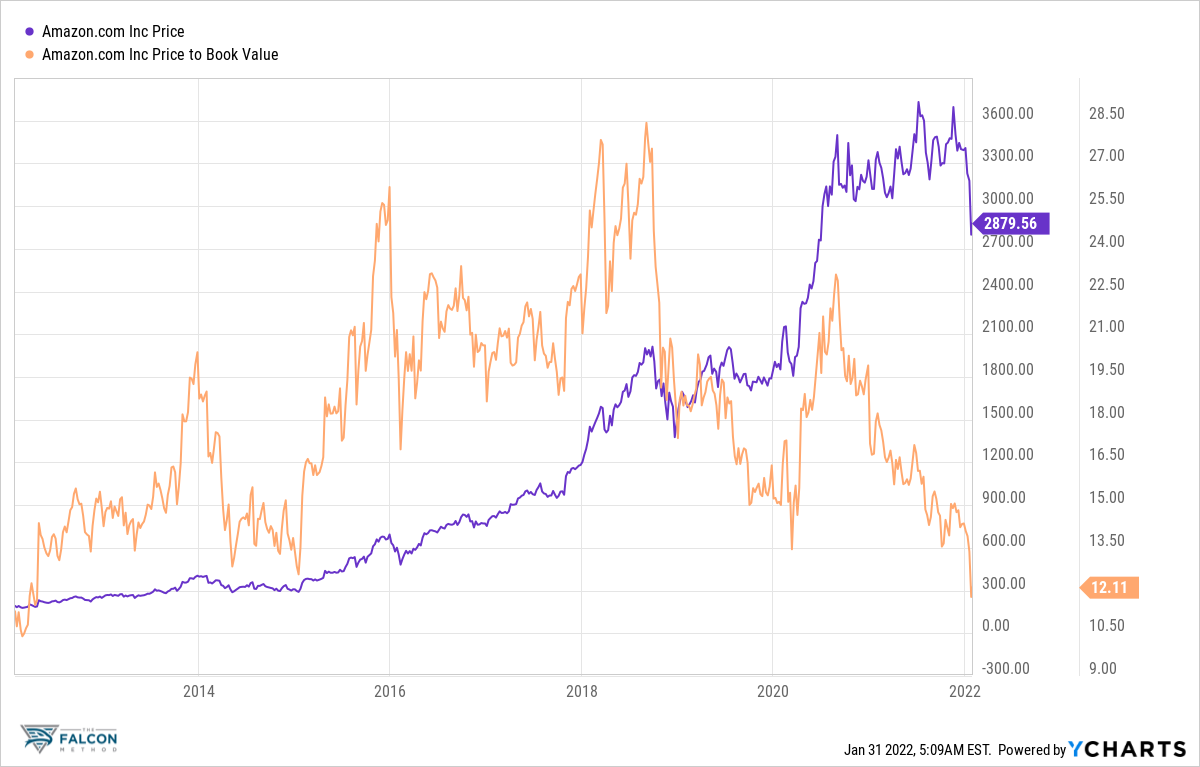
Here’s a sure bet: In hindsight, you must agree that buying Amazon’s stock at $600 around January 2016 would have been a great idea.
The thing is that the P/BV multiple of ~26 would have suggested otherwise.
That valuation metric was crying SELL at that time, while Amazon was creating shareholder value on a formidable scale. (I’ll show more on this later.) P/BV clearly doesn’t have much to offer in the modern economy, period.
Accounting is not for investors
It is no surprise that most investors have turned to the earnings power of the companies to determine their intrinsic value. Too bad the income statement fails them just like the balance sheet did!
The problem is that the income statement no longer provides a reliable indication of the value a company created in a particular year.
Accounting and reporting are not meant to help investors but for calculating taxes.
But calculating the proper earnings to pay tax is not what we are interested in since we would like to get a true picture of the company’s operations and future potential
GAAP (Generally Accepted Accounting Principles) fails miserably when it comes to treating different forms of investments.
For example, when a company builds a new factory to scale up its production and sales, money spent on the construction is not immediately reported on the income statement; instead, the new factory appears as an asset on the balance sheet, and the money spent is deducted over several years as a depreciation expense.
You might say: Standard practice, isn’t it?
Okay, but what happens if the company spends that same amount of money on R&D to come up with a new product, which could strengthen its competitive position for years to come?
GAAP accounting treats this R&D investment as an expense, which needs to appear on the income statement in full and thus pull down the current year’s earnings. If you think like a business owner, you must admit that spending on R&D and building a factory are both investments that will serve the company in the coming years or even decades, yet GAAP accounting creates distortion by treating them differently.
Or think about increased brand advertising as an example that would result in understated earnings. Under GAAP, intangible growth-producing activities are immediately expensed. For example, money spent on research and development or advertising, which pays off over time, is written off in the year incurred. Investors need to tackle such distortions.
To make matters worse, GAAP offers flexibility in deciding whether certain operating costs are capitalized or expensed.
Capitalizing the costs means that those costs will not appear in the income statement and thus will not drag down the earnings of the current period.
Instead, they will show up on the asset side of the balance sheet under some fancy name and will be amortized over time.
AOL made the most of this when they capitalized their direct-response advertising costs (that were part of their normal operations) in order to overstate earnings. To add insult to injury, once that fictitious asset grew so big on the balance sheet that even its amortization expense was hurting the manipulated earnings too much, management decided to double the amortization period of these exploding marketing costs meaning that they essentially cut the annual drag on earnings in half.
This simple accounting adjustment helped hide AOL’s huge losses from investors.
Whoever still makes investment decisions based on reported earnings numbers can easily fall victim to the “garbage in, garbage out” syndrome. You can be smart, but if your input data is of poor quality, your decisions will also be far from well-founded.
Let’s see what could go WRONG…
First, which multiple would you pick?
Is the most popular price-to-earnings (P/E) your multiple of choice with EPS in the denominator?
If so, you must be rooting for an increase in the company’s earnings-per-share so that this higher EPS, multiplied by your target PE ratio (that you wish the stock would climb back to), would give a higher share price, thus a higher return on your investment.
The problem is that EPS is the earnings that accountants calculate, and accounting has serious flaws. Accounting essentially treats shareholders’ equity as a free form of capital with no required rate of return (unlike debt, on which the firm has to pay interest).
I have yet to meet a shareholder who wants no return on their investment; still, their equity contribution is treated as free money according to the Generally Accepted Accounting Principles.
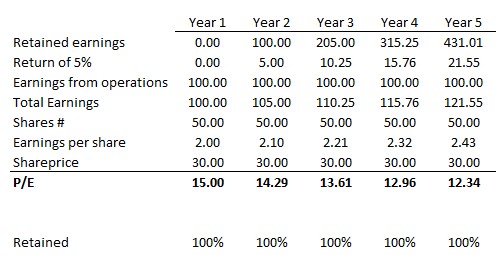
In fact, EPS can increase if all earnings are retained and simply invested at a non-zero rate.
Let me show you an example of this:
Assuming a company has earnings of $100 from operations in year 1 and retains all its earnings just to invest in a bond with a 5% annual interest rate, the company is doing better and better from an accounting standpoint. The earnings per share (EPS) increase, and the P/E decrease, signaling a better buying opportunity.
But does this make the company more valuable? Are you really satisfied with any non-zero return on that retained money that belongs to you?
From the investors’ perspective, it would be better just to pay out the earnings as dividends so that they could invest the money in other stocks, at least for the average stock market return of ~8%. Not doing so is a destruction of shareholders’ value!
To take this further, any investment financed with debt, such as a major acquisition, will contribute to accounting net income, increase earnings per share (EPS), and elevate the firm’s reported return on equity (ROE) so long as it generates a rate of return that is anything over the after-tax cost of the borrowed funds, that can be near zero these days.
Even Warren Buffett made this point in his 2017 letter to Berkshire shareholders:
“The ample availability of extraordinarily cheap debt in 2017 further fueled purchase activity. After all, even a high-priced deal will usually boost per-share earnings if it is debt-financed. At Berkshire, in contrast, we evaluate acquisitions on an all-equity basis.”
Any firm can show positive net income and EPS along with EPS growth as long as it is covering the after-tax cost of the money it borrows. In accounting, stockholders’ equity is considered free.
As long as you have any return expectation when you invest in stocks, you must disagree with the Generally Accepted Accounting Principles (GAAP), and you most certainly need to address this issue when making investment decisions.
EPS says nothing about the true value creation of companies; thus, any multiple based on EPS should be used very carefully, if at all.
What about sales?
The biggest advantage of the commonly used P/S (price to sales) metric is its simplicity. Too bad the pros end here…
One of the downsides of the P/S ratio is that it doesn’t take into account whether the company makes any earnings or whether it will ever make earnings. Profitability makes all the difference! Consider a firm that loses money on every sale… Would you be happy with a high sales number, thus a seemingly cheap P/S multiple? Not really!
A dollar of sales at a highly profitable firm is worth more than a dollar of sales for a company with a narrower profit margin. Thus, the P/S ratio is generally useful only when comparing firms within an industry or industries with similar profitability levels, or when looking at a single firm over time.
In short: price to sales is not your reliable guide when assessing a stock’s valuation.
…but we still have cash flow!
“Earnings can lie, but cash flow cannot,” you may say. Unfortunately, I’ve seen too much to agree. While turning our attention to the cash-generating capability of the business is a great way to tackle most of the accounting distortions or outright manipulation, you have to accept that even the cash flow numbers can be fudged. Let me show you how!
Managers know that sensible investors are trying to estimate the sustainable level of cash flow that the company can produce, as only this can be the basis of a sound valuation. The cash flow statement is made up of three parts: operating, investing, and financing sections.
Of these three, cash flow from operating activities is the only one that is deemed sustainable since, unlike the cash provided by investing or financing activities, operating cash flow comes from a renewable source, operations.
It’s no surprise that managers want to classify as much of the cash flow as operating as legally possible, even if that classification may not match the economic realities of the business.
Again, GAAP provides ample room for playing with certain items. (You can find dozens of tricks in the book Creative Cash Flow Reporting by Charles W. Mulford.)
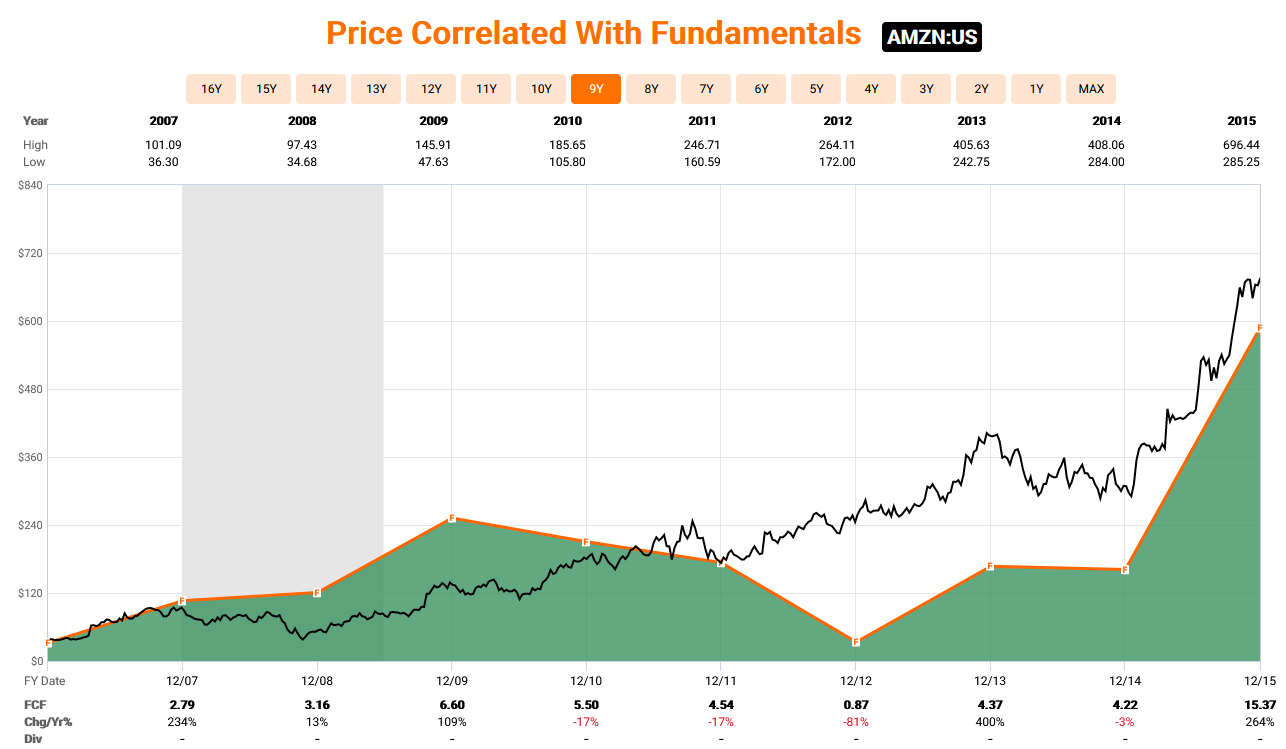
Looking at Amazon’s free cash flow (that is, operating cash flow minus capital expenditure) still doesn’t seem to explain the continuous upward momentum of the stock price. Looking at the green area showing free cash flow, all you see is bumpiness while the stock price was relentlessly moving up.
We need a much better explanation, a much closer relationship with the stock’s performance. Cash flow is just not good enough!
If cash is king… what about a free cash flow multiple?
Free Cash Flow (FCF) can be calculated by deducting capital expenditures from the operating cash flow. Basically, FCF is the amount of cash that remains after everything has been paid, all new investments have been made, and is available for distribution to the shareholders. The key question goes: Is more free cash flow always better? Not really!
A large amount of free cash flow may indicate that the company can’t find sufficient opportunities for new investments, which can limit future growth prospects. Negative free cash flow, on the other hand, could indicate that the company has an abundance of investment opportunities but not enough internal cash flow to pursue all of them.
In fact, FCF in any one year, or even over longer intervals, is not a reliable measure of performance. You saw this in Amazon’s example, right?
The key question is whether the company is investing in positive NPV (Net Present Value) projects that have attractive returns above the cost of capital. If yes, the more investments it makes, and the lower or more negative its free cash flow goes, the greater value is created (that will be reflected in the stock price).
It is simply not possible to tell whether a firm is more or less valuable by generating more or less free cash over a period of time, so there go the P/FCF and EV/FCF multiples out of the window.
That said, when I studied at Columbia Business School’s Value Investing and Advanced Value Investing courses, they advocated using EV/FCF and EV/EBIT as valuation multiples. Knowing what I know now, I’m not that fond of either. I’ll show you in a minute what my preferred metrics are and how I use them.
If you wish to devote some time to killing all the popular multiples containing EBIT, EBITDA, or book value, you may want to read the book Best-Practice EVA by Bennett Stewart. Not an easy read, but you can find examples there that illustrate how continuing growth in sales, EPS, EBIT, and EBITDA can be produced without any increase in shareholder wealth.
Even the PRICE is flawed
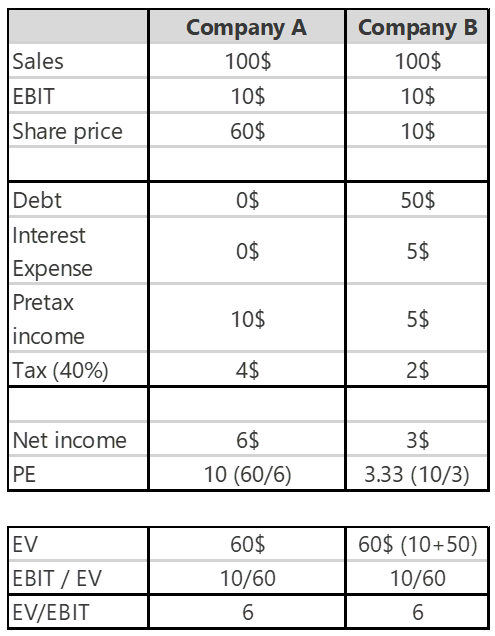
That said, the price (P) part of the ratio has its flaws as well. See Joel Greenblatt’s example below (from his book The Little Book That Still Beats the Market):
While A and B are the exact same companies, the difference in their capital structures distorts the PE (and all capitalization-based multiples, for that matter). Have you ever thought about this when mechanically applying your PE targets in a tool like FAST Graphs?
Sure, multiples using Enterprise Value (EV) instead of price address this problem, but as soon as you pick EBIT, EBITDA, or Free Cash Flow as the second part of your EV-based ratio, you may be in for some trouble.
As for EBITDA, Warren Buffett likes to say: “Does management think the tooth fairy pays for capital expenditures?” Excluding the necessary capital expenditures from any profit category (and valuation multiple) is a deadly mistake, and this is precisely what EBITDA does.
You may think EBIT could come to the rescue since it doesn’t exclude the depreciation and amortization part. True, but this earnings category is still derived from the profit & loss statement that is plagued by tons of accounting distortions.
With Free Cash Flow (FCF), as we mentioned earlier, our biggest issue is that greater FCF is not always better, as it can simply mean that the firm has no profitable reinvestment opportunities to pursue. Simply put, you cannot tell by a company’s FCF performance whether it is a good or bad business; consequently, you cannot use the FCF yield or EV/FCF metric to assess the valuation.
Warning: Not All Growth is Equal…
Many investors are fixated on growth (mostly EPS growth), and few take the time to contemplate that:
Not all growth creates shareholder value!
What I learned at Columbia Business School, the cradle of value investing (where Warren Buffett himself studied), was in perfect sync with what the EVA guys were saying.
Completing Columbia’s Value Investing and Advanced Value Investing courses taught me that the only type of growth that creates real value is where the incremental invested capital produces a higher return than the true cost of that capital.
EPS growth is easy to fabricate and is thus 100% meaningless! Remember the previous example of the company that invested in bonds at 5% interest and thus achieved earnings growth!
Or imagine a company that already has an extensive store network and great coverage in the country. Since management’s goal is to show growth, the retained earnings are not paid out as dividends but are used to open even more stores.
However, the returns for these new units are subpar (not as good as the previous ones), since the best locations are already taken.
Let’s say the company only achieves a 6% return on these new stores. Revenue and profit increase, and so growth is achieved. Well done?!
However, the shareholders are worse off because the return on this newly invested money is less than what they could have earned by investing in the market themselves. This is a typical example of how focusing on earnings growth can lead management and investors astray.
The company created no real value, and shareholders shouldn’t be too happy with such a management team, but GAAP accounting provides reasons to celebrate for the ignorant investors. You should definitely break out of that category!
Do not follow the herd: Most valuation multiples are plain wrong!
Listen closely because this can be a game changer for you.
Everything you have just read comes down to a very important finding: the most widely-used valuation multiples can fool you (and other investors).
You’re not alone; most investors use multiples when it comes to assessing a stock’s valuation.
Your key takeaway is this:
The relevant metrics of business valuation may have evolved as decades went by, but as Berkshire Hathaway’s vice chairman Charlie Munger told at the company’s 2007 annual meeting:
“There is no one easy method that could be simply mechanically applied by, say, a computer and make anybody who could punch the buttons rich. By definition, [investing] is going to be a game which you play with multiple techniques and multiple models, and a lot of experience is very helpful.”
I couldn’t agree more.
Sensible stock investing is way too complex to qualify as a hobby or a part-time job. This is a profession!
At the FALCON Method, we are not “playing the stock market” but make thoughtful investment decisions supported by our evidence-based stock selection process. The difference between the two approaches is night and day!
Want to learn more?
This is how we value companies, based on their TRUE PROFIT metric, instead of the common multiples.
The FALCON Method newsletter service is there to support your investment decisions for a fraction of the fee we pay for the institutional-level data, so you get the work of our experienced analyst team as a bonus.
Ready to take the guesswork out of investing and get to the next level?
Learn more about how the FALCON Team uses these data to find the best stocks, or join our webinar on stock investing for free.


